ResidentialEnergyLaboratory.comLinks:Home PageHouse Construction Details Net Energy Use Energy Use Details Costs and Payback for Net-Zero Infrared Images of REL Energy Efficient Design Comparison of PV Systems R-Value of Cellular Shades Energy Codes for Windows Solar PV Raw Data Related Links About Us Contact Site Map | Infrared Thermal Images of theResidential Energy LaboratoryInfrared thermal cameras provide images that provide temperature maps of buildings or other objects. These images of the outside of a house during cold weather show where the building is losing energy by locating hot spots on the house. A well-insulated house will appear uniformly cold on a cold night, while a house that is not well insulated will appear warmer since it is conducting heat from the warm inside of the house through the walls to the outside. Since windows and doors conduct more heat to the outside than a well-insulated wall, they will appear brighter and warmer than the walls, as shown in the image below. Interestingly, the "bones" of the house also often appear in infrared images, since the studs of a wood frame house conduct more heat to the outside than an insulated wall. The vertical lines in the infrared image below are studs in the walls.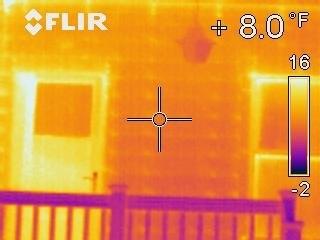 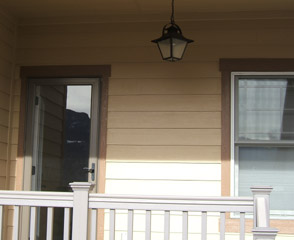 Infrared images of the inside of a house on a cold night can show cold spots that indicate places where heat is more rapidly being conducted to the outside of the house. If a blower door is mounted in the door of a house, as shown below on the left, with a fan blowing outward, then air will be pulled into the house cooling the areas around the leaks, and these areas will show up as cold spots on the infrared images, as shown below right. The image below right is of a window with a shade down, with cold air entering the house around the edges of the shade. Further details are given below. 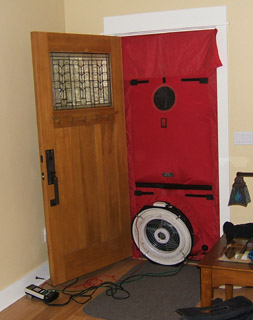 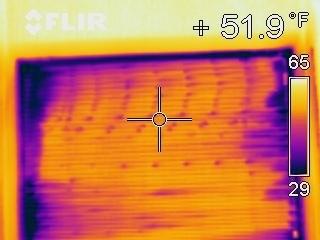 Infrared thermal images were recorded on the outside and inside of the Residential Energy Laboratory at 1800 hours (6 PM), just after sunset on a winter evening with a air temperature of about -12°C (10°F). It would be more ideal to take images at the minimum outdoor air temperature before sunrise, but this is not easy to arrange. An infrared camera assigns temperatures based on the intensity of infrared radiation, but must assume an emissivity to relate the intensity to temperature. Emissivities vary for different materials in an image, so typically an emissivity of unity is assumed. This will result in indicated temperatures slightly lower than actual temperatures. Therefore, the temperatures in the images below are slightly lower than actual temperatures. Glass, and especially low-emissivity glass, usually gives false readings for temperatures. The infrared images were taken by Mr. Chris Martin, Headwaters Energy & Finance, Buena Vista, Colorado, using an FLIR B2 model infrared camera. The comparison visible images were taken by staff of the REL. Construction photos were taken by Mr. Richard Pautz. The first pair of images below show the right front of the Residential Energy Laboratory (REL) in both infrared and visible wavelengths. The second pair of images is for a neighbor's house with a similar floor plan, and constructed during the same year. The REL walls include rigid foam over the 2x6 walls, which should reduce the thermal bridging of the studs. The REL includes a storm door, while the comparison house does not. The studs are slightly more visible in the infrared images for the reference house than the REL. Also the reference house appears to have more heat loss along the bottom of the wall than the REL. For both houses the doors and windows are significantly warmer than the walls, especially the front door for the reference house. Since the REL includes a storm door, the heat losses should be reduced compared to the reference house, but the glass in the storm door tends to throw off the infrared images. For both houses the stem walls on the crawl space show up as warm, being bright in the IR images. This is likely due to their contact with ground at the base of the foundation that is considerably warmer than the air temperature. Also the thermal inertia of the concrete walls is significantly greater than the walls of the house. Presumably the concrete walls would show up cooler if the images were recorded after the concrete walls had a chance to cool off. Notice how the large rock in front of the REL also retains more heat than the surrounding ground. 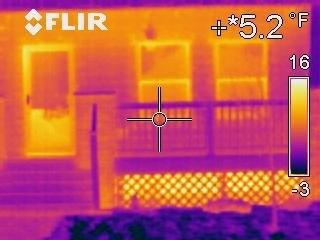 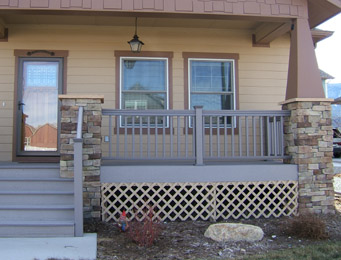 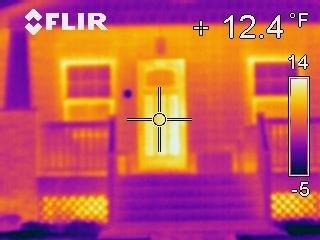 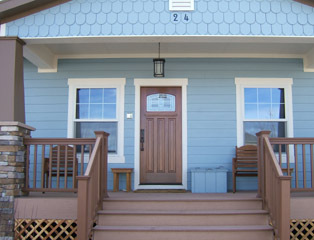 Another comparison between the REL and the reference house is shown in the images below, with the REL shown first and a similar wall on the reference house shown below it. Both infrared images are on the west sides of the houses. The studs are only slightly more visible in the reference house, even though only the REL has 50-mm (2") of rigid foam on the outside of the stud wall and under the cement fiber siding. The REL also indicates a slightly lower outside wall temperature, which may or may not be significant within the measurement precision. 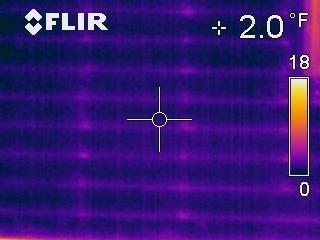 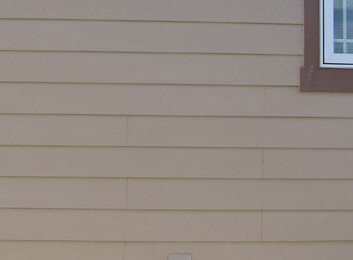 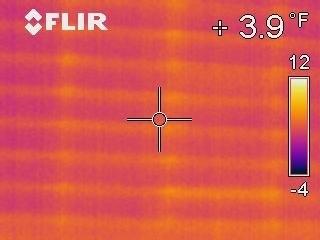 Another image of the REL on the west side that includes windows shows a uniformly well-insulated wall, with a double-hung window on the right that shows higher heat loss along the sealing surface between the upper and lower sashes. This leakage "hot spot" was characteristic of all the double-hung windows in the REL. 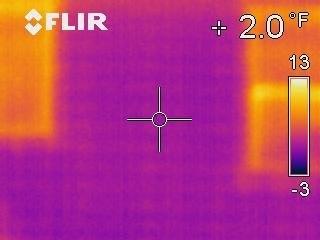 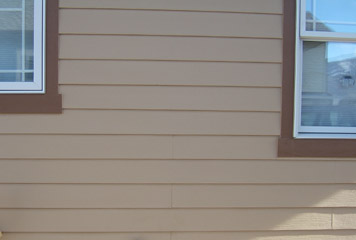 The studs are slightly visible in the infrared image on the east side of the REL through the rigid foam and the siding, as shown in the infrared image below. The indicated temperatures might be slightly lower on the east side than the west side since the images were taken just after sunset when the west side would have been in the sun more recently. 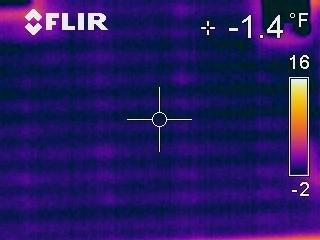 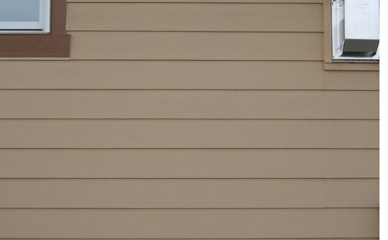 The back of the REL includes three high solar gain windows in the back bedroom. For the images shown below, the left-most window had the insulating cellular shades down and the side seals in place, the center window was the same except the side seals were removed, and the right-most window had the shade up. The right hand window appears warmer than the other two, in agreement with the insulating shade being raised. The heat loss is greater above the windows than in the rest of the wall since the extra studs used to support the window structure, that are shown below the thermal image, displace some insulation and allow thermal bridging. The heat loss is greater along the top of the wall than the bottom, presumably because the inside temperatures were higher near the top of the inside wall. The wall studs are slightly visible in the infrared image. The stem walls (foundation walls) are relatively hot, but it is assumed that much of this heat is due to their high thermal inertia and the fact that the air temperatures were dropping when the images were captured, and the conduction of heat from warmer ground lower down. These walls were fairly well insulated from the conditioned crawl space with RSI = 3.3 (RUS = 19) continuous fiberglass batt insulation on the inside of the stem walls. 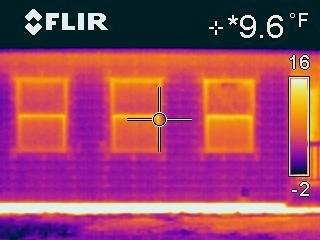 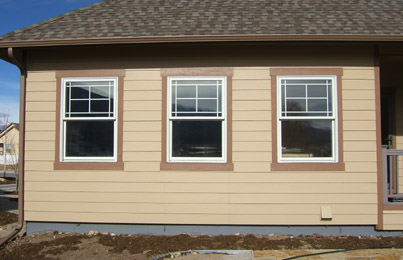 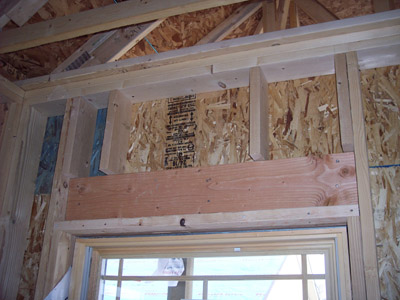 Infrared images of the windows from both outside and inside showed the most significant leakage around the kitchen window, as shown in the infrared image below. After the infrared images were recorded, the window was checked, and it appeared that the window locks were forcing the gap between the sashes open. These locks were refastened, and the window better sealed. This better seal was not verified with further infrared images. 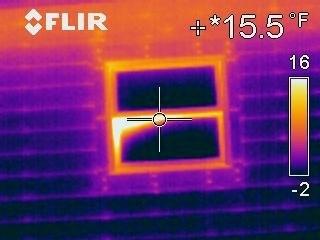 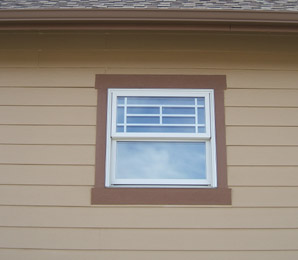 Infrared images were also recorded on the inside of the house, but in this case the blower door was causing a minor suction on the house to a 50 Pa (0.2 in. of water) pressure difference with the outside air. This allowed leaks to be exaggerated by pulling cold air inside, with leak detection by both infrared imaging and a smoke pencil. The same kitchen window that showed up as leaky from the infrared image from outside also showed up as leaky from the infrared image for the inside that was taken with the insulating shade down, so the cold air was pulled in around the outside of the shade, as shown in the image below. 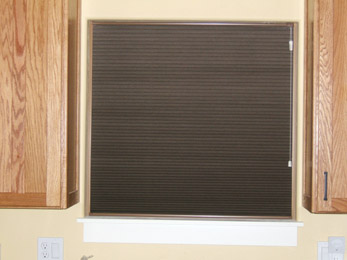 One other window in the REL showed a cold air leak into the house, a window in the living room, as shown in the infrared image below. 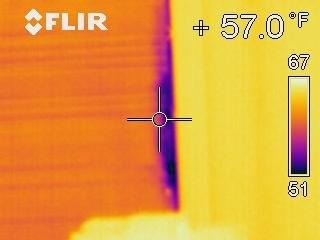 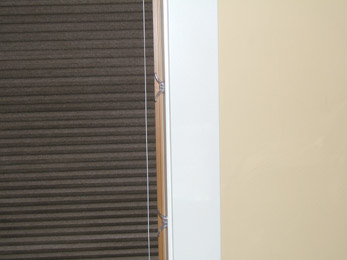 The other windows did not show significant air leaks around the shades with the blower door operating, with typical infrared images like the one below. This window had the shade down but the side seals removed. The windows operate like a reverse radiator, with warm air coming in at the top, cooling as it loses heat to the window, and then flowing out the bottom sides of the shade, as shown by the arrows in the figure on the right below. The infrared images show that the shades are warmer at the top and cooler at the bottom, as expected due to this air flow pattern. Temperature measurements have been recorded for the windows with the shades down, with the side seals in place, and also with the side seals removed. These temperature differences are quantified in the section Testing at REL. 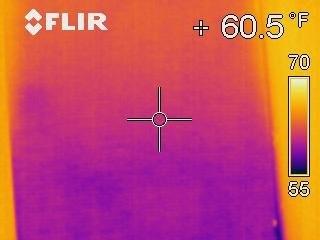 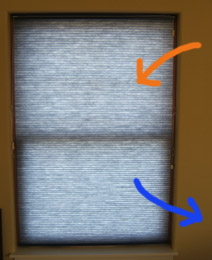 The double-hung windows in the REL tended to have the worst air leaks along the seal between the upper and lower sashes, as shown in the infrared image below of a window with the insulated shade up. In spite of all these comments about leakage around the windows, in this climate zone the high solar gain windows result in a significant net GAIN of net energy due to the high solar insolation, except for the windows along the north side of the house. Further, the measured total air infiltration at 50 Pa (0.2 in. water) differential pressure for the REL was 2.45 air changes per hour (ACH), corresponding to 0.15 natural ACH, where "natural" means under normal operating differential pressures. This is also referred to as the Natural Leakage (NL) rate. The value of 0.15 corresponds to a tight house compared to existing housing stock of houses described by Max H. Sherman and Nance E. Matson in "Air Tightness in New Houses in the U.S., A Preliminary Report," LBNL 58671 as shown below, although this report was dated 2002.  They report much lower infiltration rates for "new" (as of 2002) housing stock, with an average natural leakage rate of 0.55, as shown below.  The infiltration results for the REL are not close to the Passive House standard of 0.6 ACH at 50 Pa (0.2 in. water) differential pressure (see passive house standards), which would correspond to a NL of about 0.03. To make it tighter, the construction plans would have required casement windows or fixed windows rather than double-hung windows, but single or double-hung windows were required by the subdivision rules. Based on the infrared images showing modest leakage between the upper and lower sashes, some better means of sealing the sash gap was investigated. It was found that there exists a cavity just above the sealing surface between the sashes and parallel to the sash seal measuring approximately 11 mm (7/16") in diameter. A cylindrical poly foam cord material 12.7 mm (1/2") in diameter was cut to fit into the cavity to help seal this leakiest part of the double-hung windows. However, this makes the window inoperable unless the foam is removed, so for fire safely it should never be used in bedrooms, or other rooms without easy access to an exit door from the house. The effect of the poly foam material on leakage as determined by infrared images or blower door tests has not been measured. 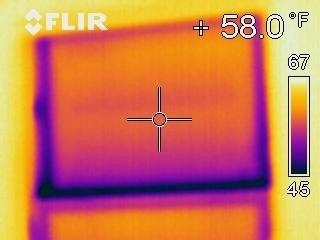 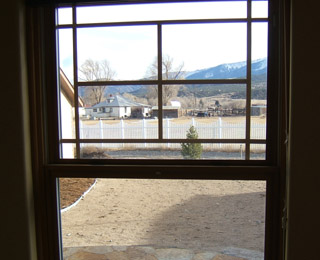 Another place that air infiltration was observed was around one electrical outlet. This air infiltration was observed first with a smoke pencil, as shown below on the left. The infrared image on the right also showed a slight cooling of the electrical outlet due to the leak. 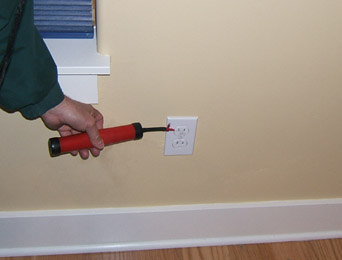 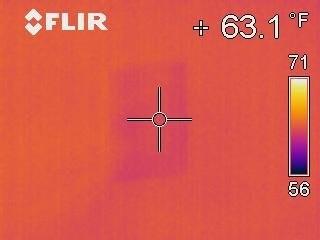 This leak around the electrical outlet occurred in spite of the infiltration reduction boxes used around all the electrical outlets on external walls, as shown in the pictures below. 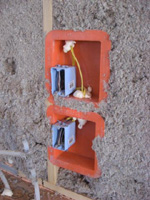 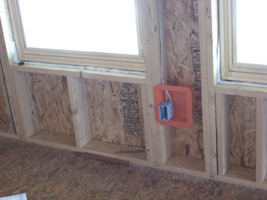 No major thermal leaks were located in the house other than those discussed above. However, increased heat loses were observed around concentrations of the studs, as shown for the northwest corner of the house below. 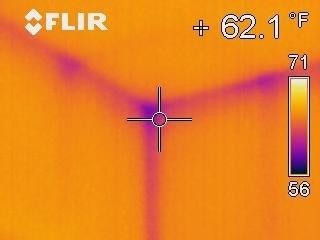 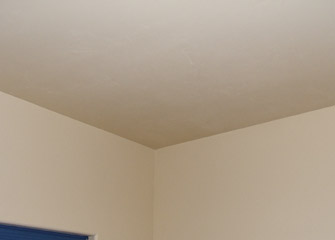 Similarly, the infrared images showed the increased heat losses along the wall studs and headers as shown below. 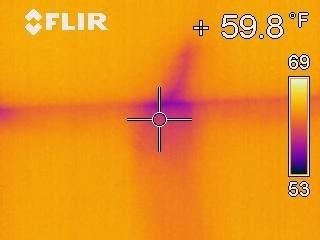 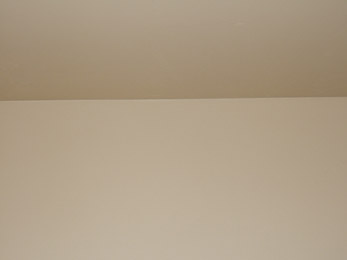 The higher heat transfer point visible in the infrared image above is directly traceable to the combination of five studs used in the wall that were an anchor point for supporting the front of the house, and are shown in the image below. The studs are much better thermal conductors than the cellulose insulation used in the wall where studs are not present. (The picture below is before the insulation was installed.) Also notice the confluence of studs in the corner of the building where the infrared image above showed higher heat transfer. The thermal bridging by the studs lends support to the idea of using rigid XPS foam on the outside of the building to make sure that there is significant insulation covering over the thermal bridging. 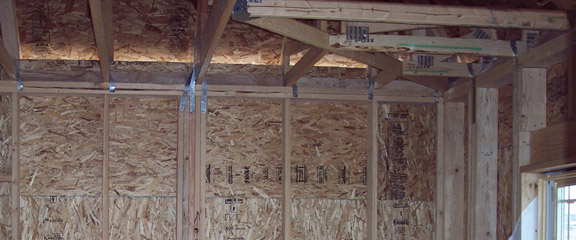 There was only one point on the ceiling that showed up as a cold spot as viewed from inside, and it is shown in the infrared image below left. Again the higher heat transfer at that point appears to be due to the confluence of studs as shown in the construction image below. 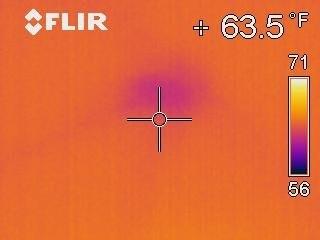 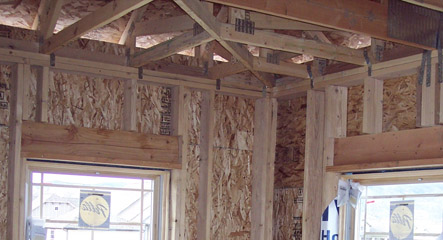 Although the infrared imaging is not quantitative for the most part, it is very helpful in finding leaks and high heat transfer points that might not be obvious otherwise. |