ResidentialEnergyLaboratory.comLinks:Home PageHouse Construction Details Net Energy Use Energy Use Details Costs and Payback for Net-Zero Infrared Images of REL Energy Efficient Design Comparison of PV Systems R-Value of Cellular Shades Energy Codes for Windows Solar PV Raw Data Related Links About Us Contact Site Map | RESIDENTIAL ENERGY LABORATORY -Net Source EnergyThis page documents the progress toward meeting the
net-zero source energy goal up to the current date. To be sustainable, a house must meet net-zero
source energy. It may be
"green" without meeting this goal, but to be sustainable, it must
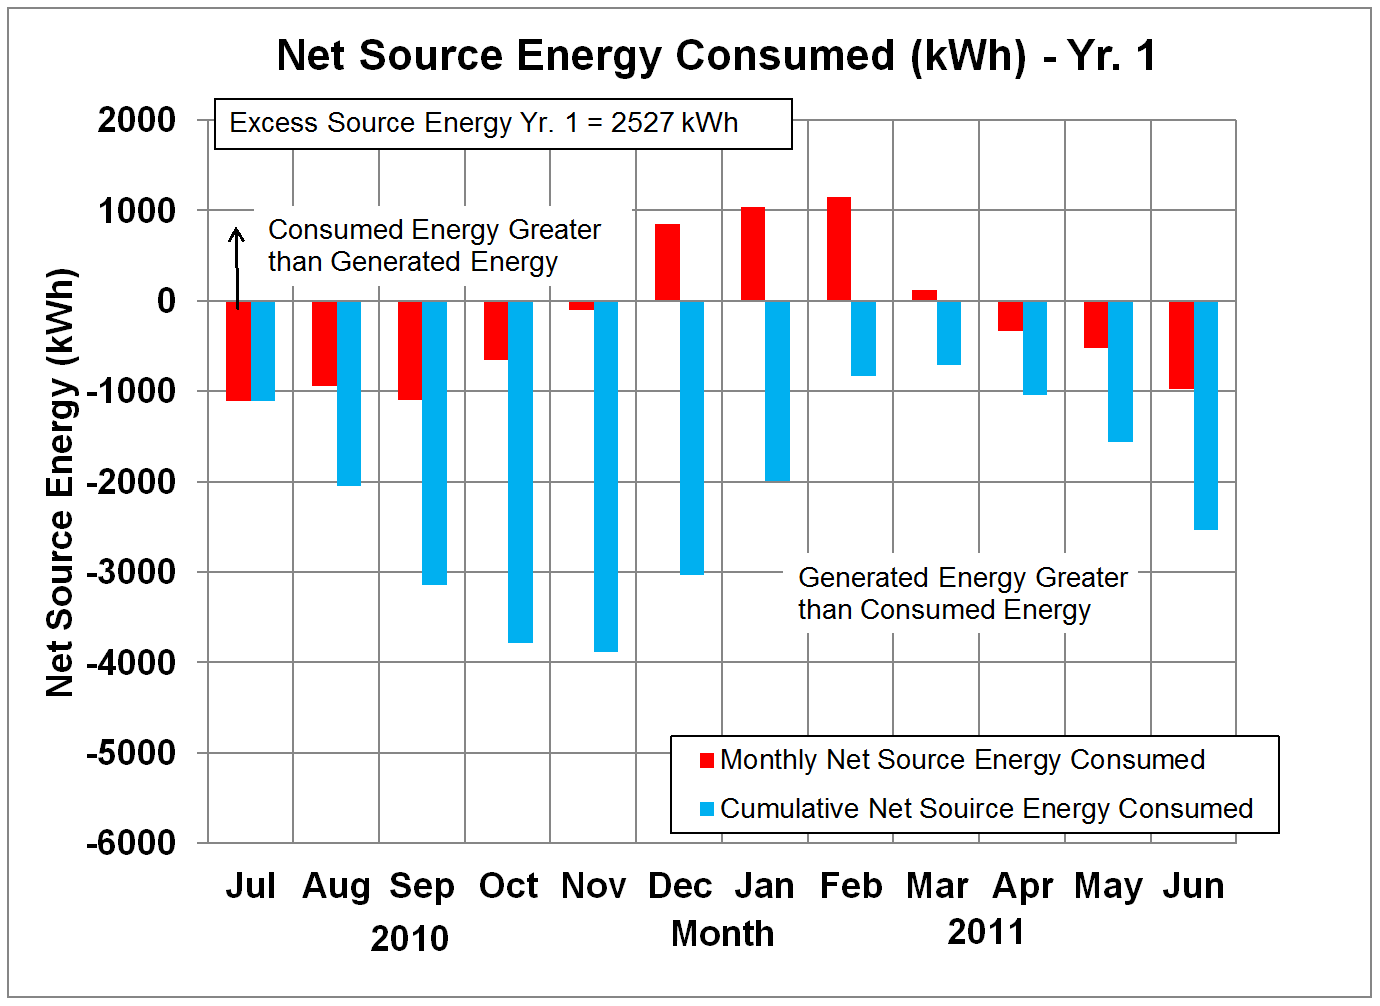
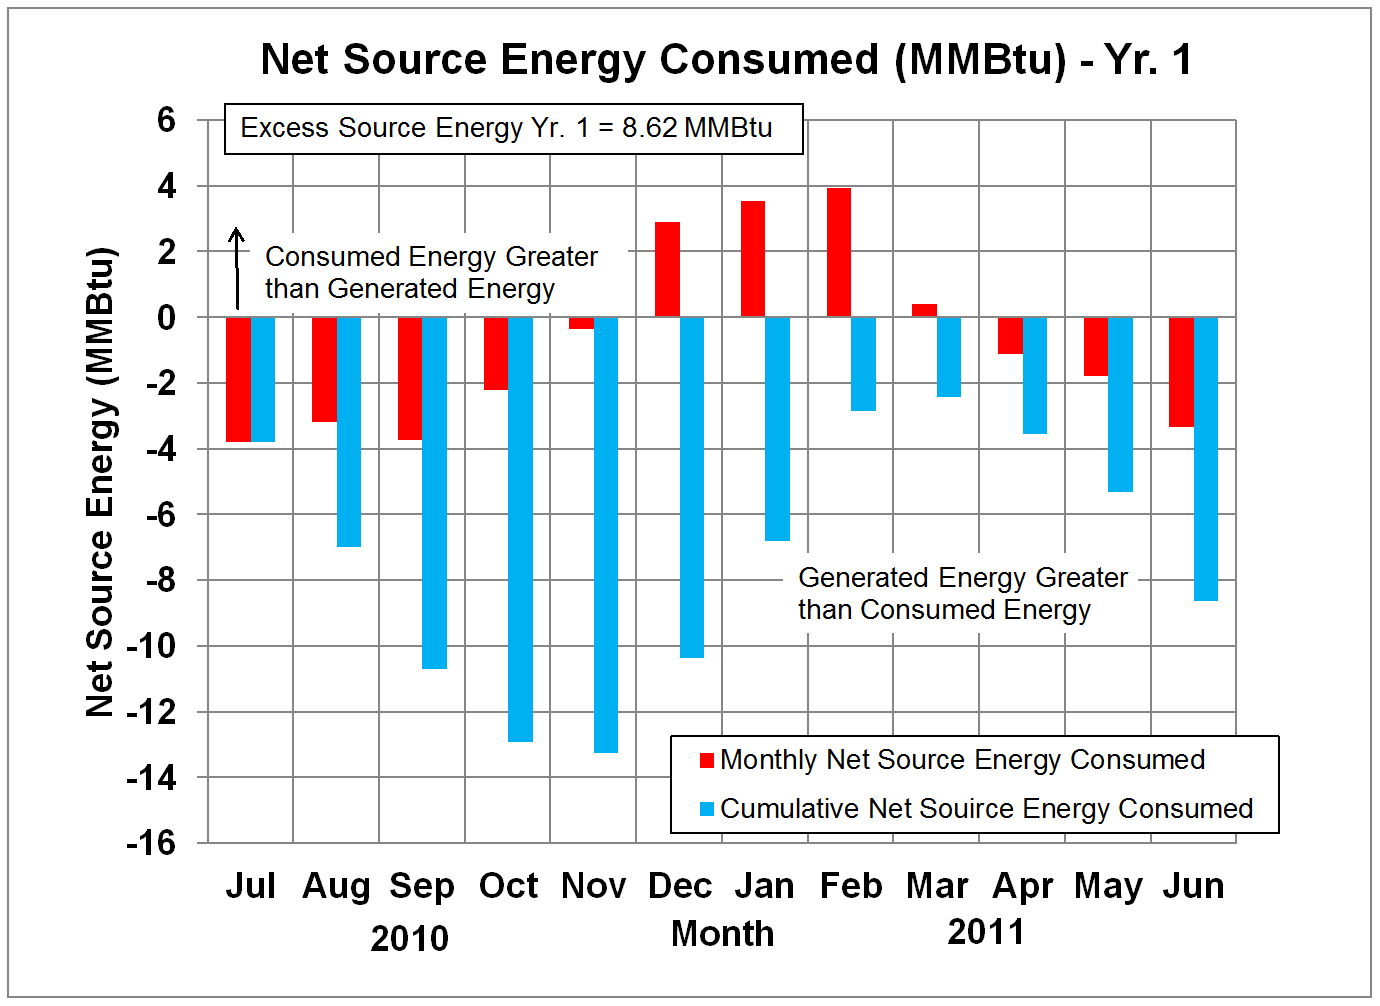
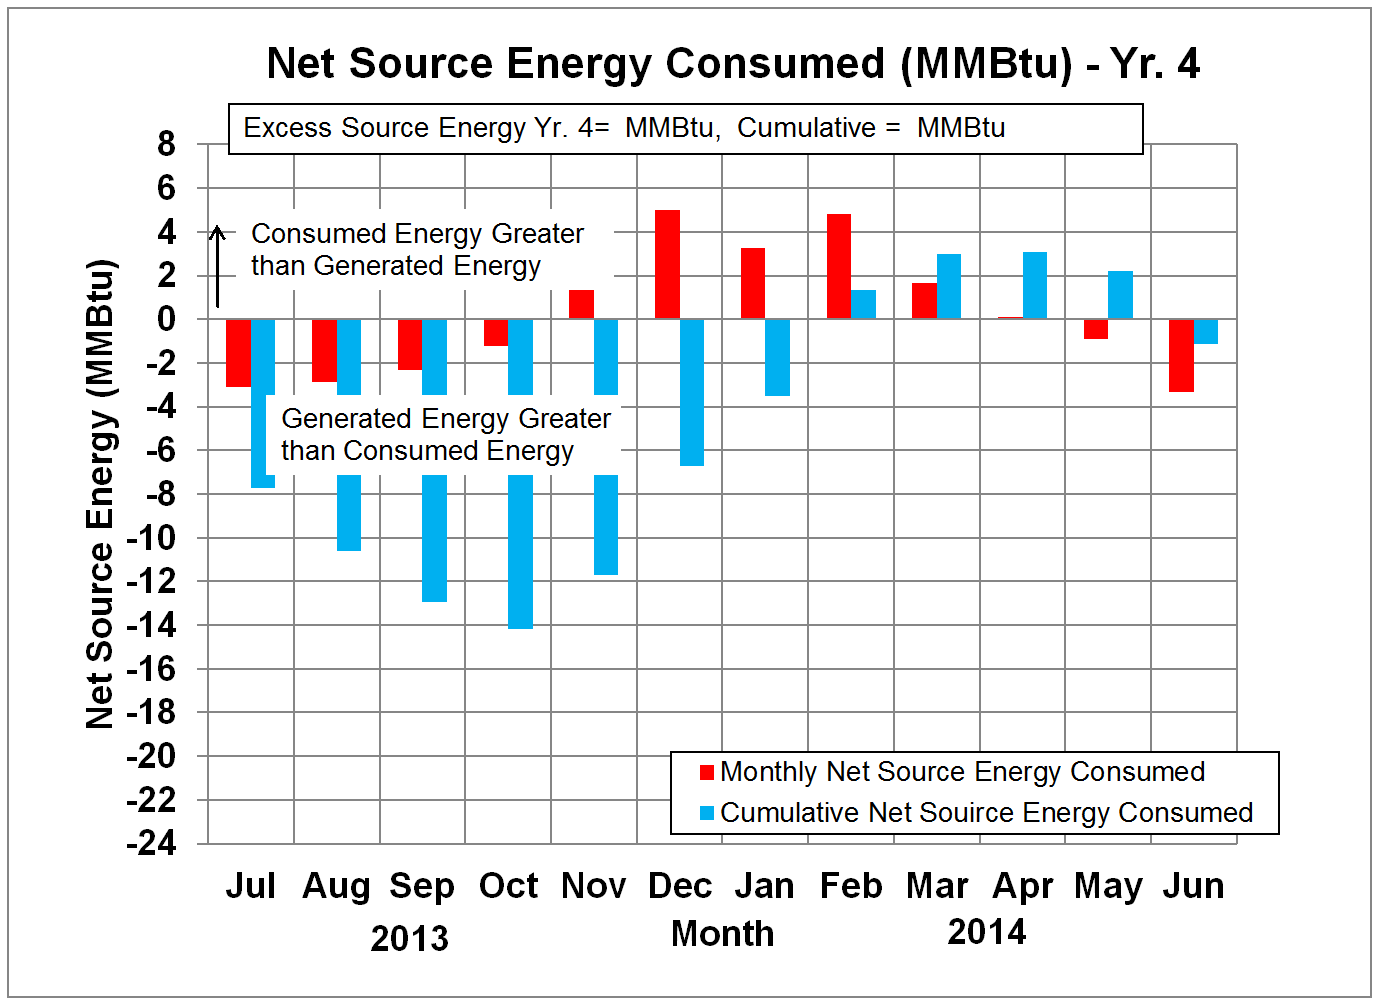
meet the goal. The PV panels were installed and became operational on 18 May 2010. The house was first occupied toward the end of June 2010. Each month of operation so far, the PV panels have generated more than 100% of the electricity used by the house, and since the system is grid-tied, this excess electricity has built up a reserve of energy that can be traded off against the natural gas used for space heating, hot water heating, and cooking. The expected trend is for energy to be stored up by the house during the warm part of the year, and those reserves used up in the winter, and that is what is observed in the figures below. The net energy use is summarized in the figures below. In each figure, the net source energy for each month is presented, as well as the cumulative net source energy startng at zero on July 1, 2010. The house has been fully occupied since that date except for vacations. The first four figures shows the monthly net source energy and the net cumulative source energy expressed in kWh for the first four years of operation. These results show that the house currently is operating with a surplus of energy, and has exceeded the goal of generating more source energy than it consumed for the first three years.
The four figures below show the same information in millions of Btu (MMBtu):
So
during the first year of operation, the house generated 2527 kWh (8.62
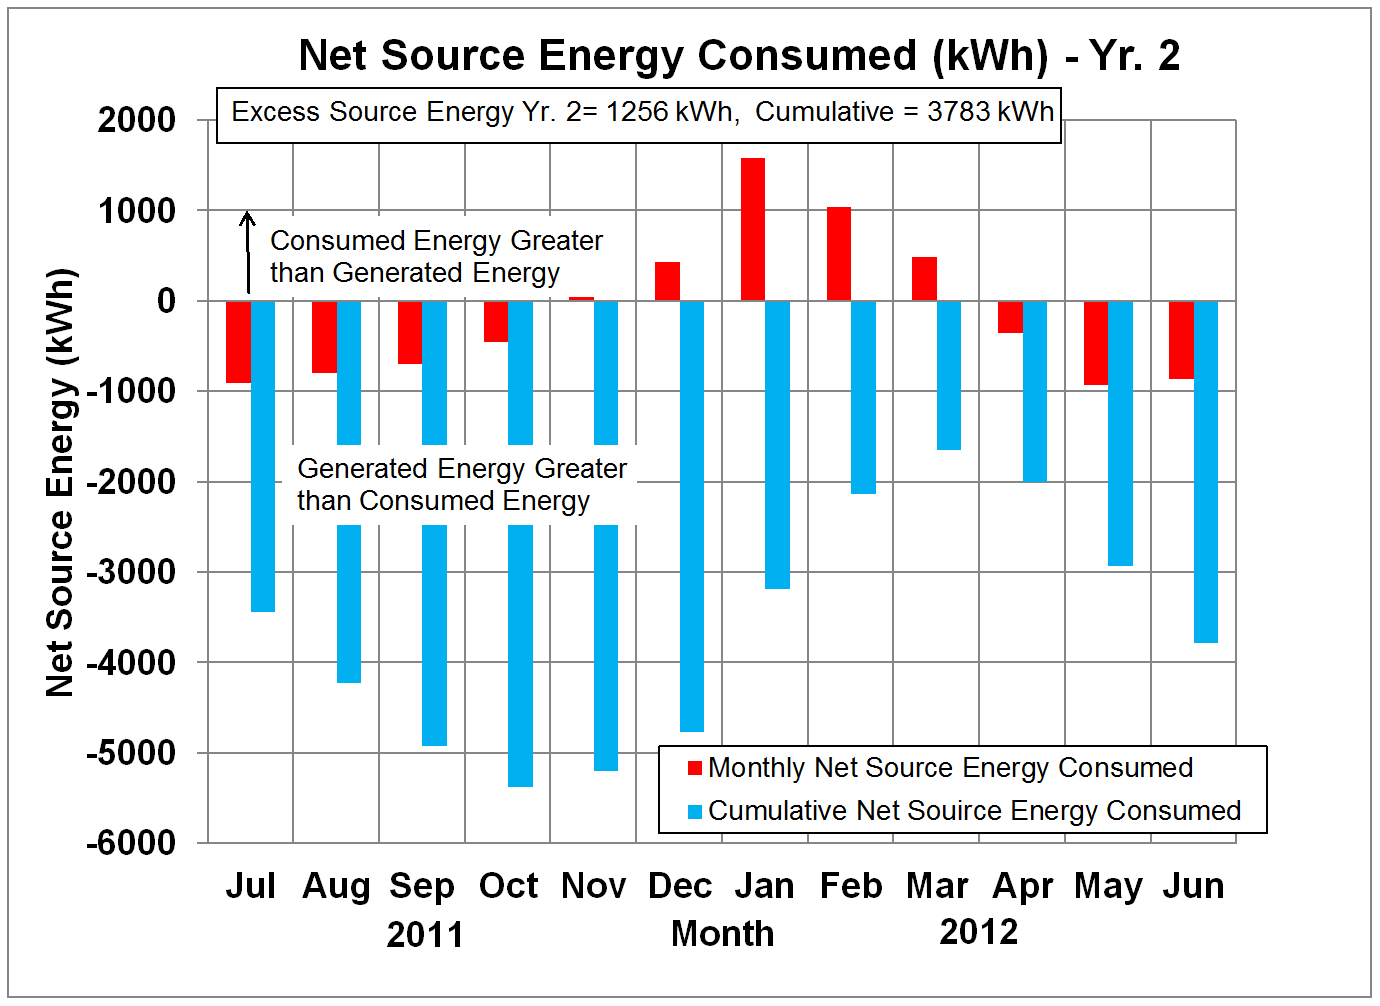
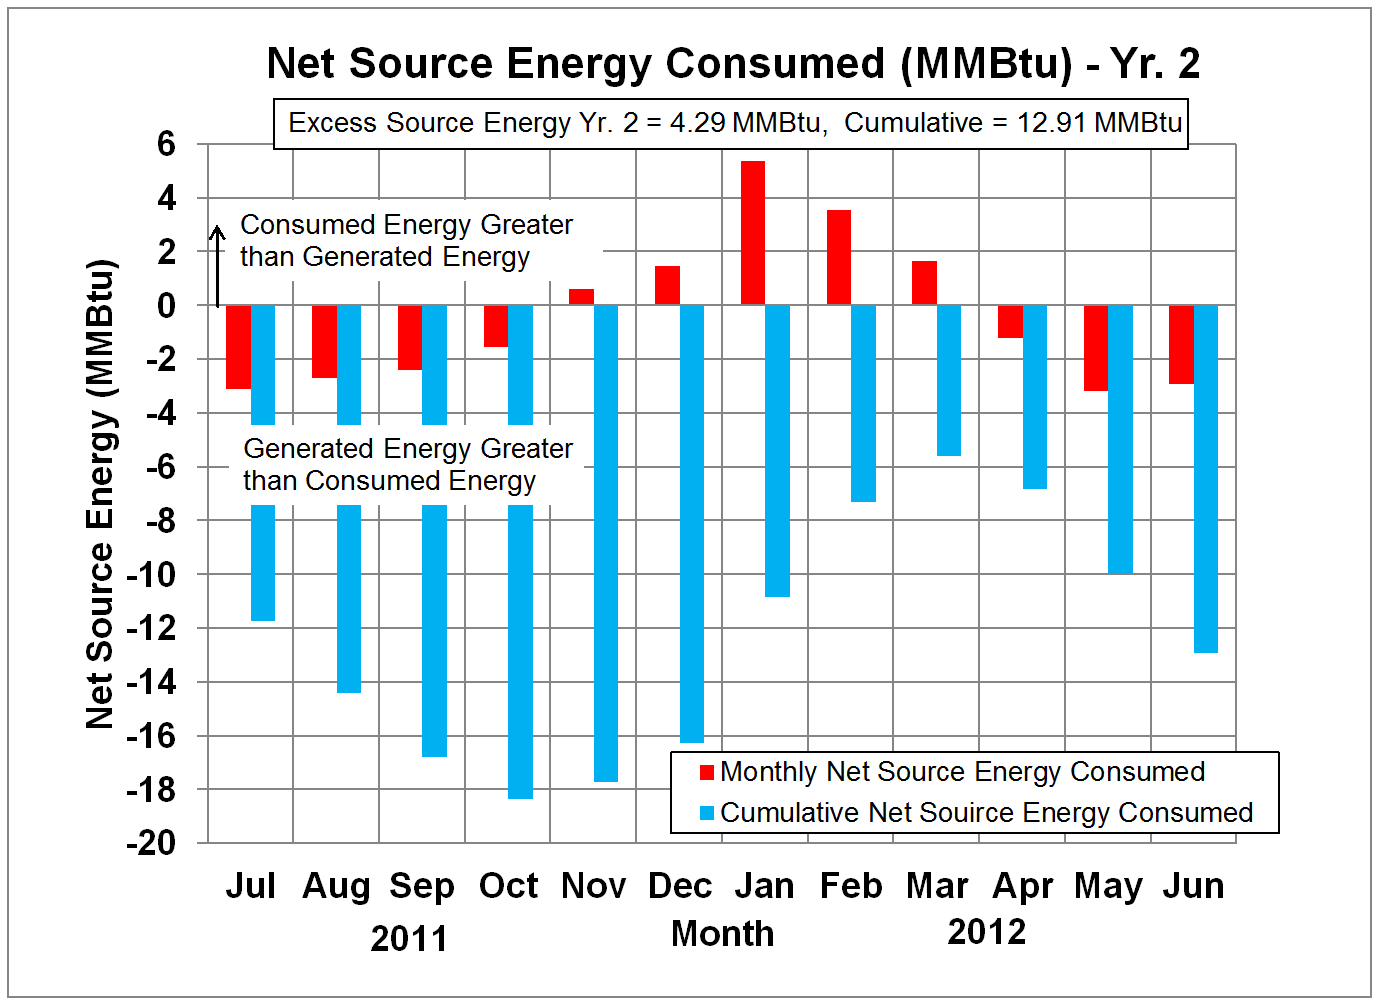
MMBtu) more source energy than it consumed, and during the second year,
the house generated 1256 kWh (4.29 MMBtu) more source energy than it
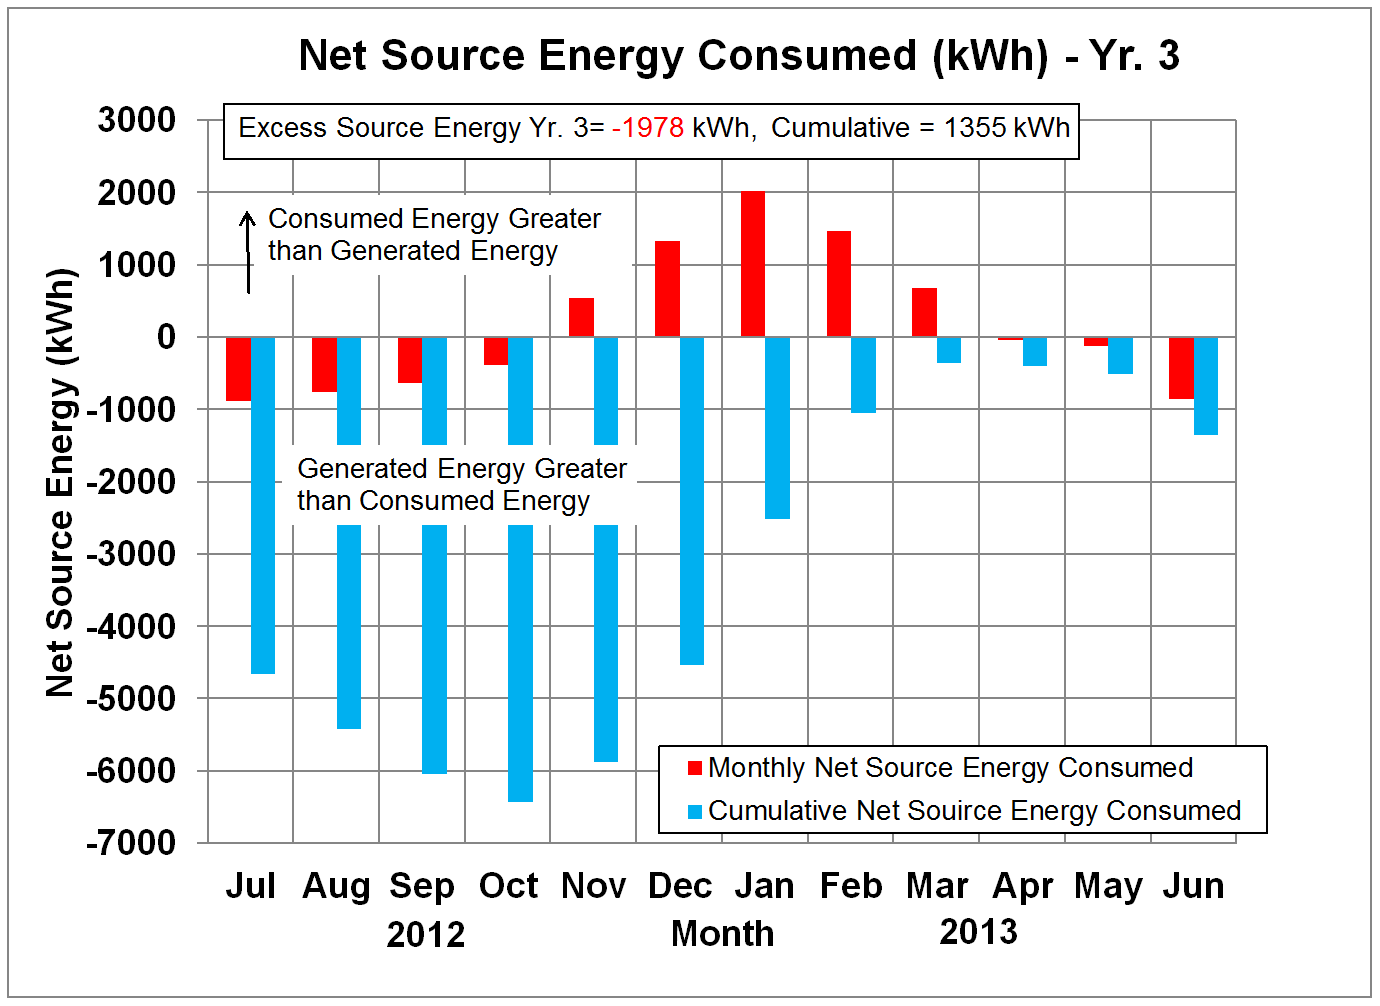
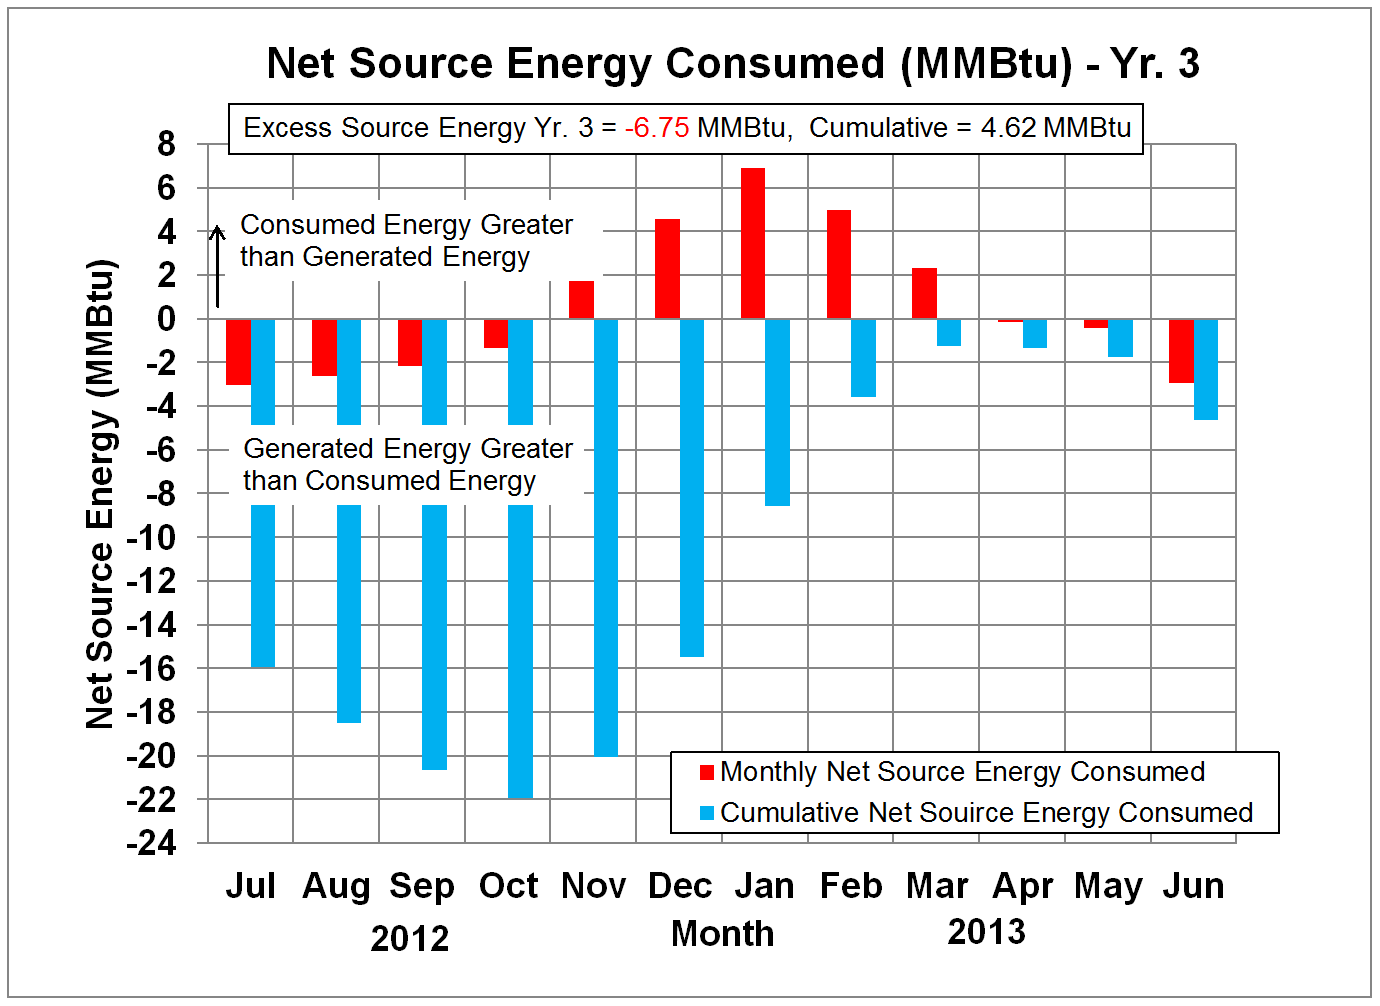
consumed. During year three, the house used more energy than it
generated, by 1978 kWh (6.75 MMBtu) because the winter was
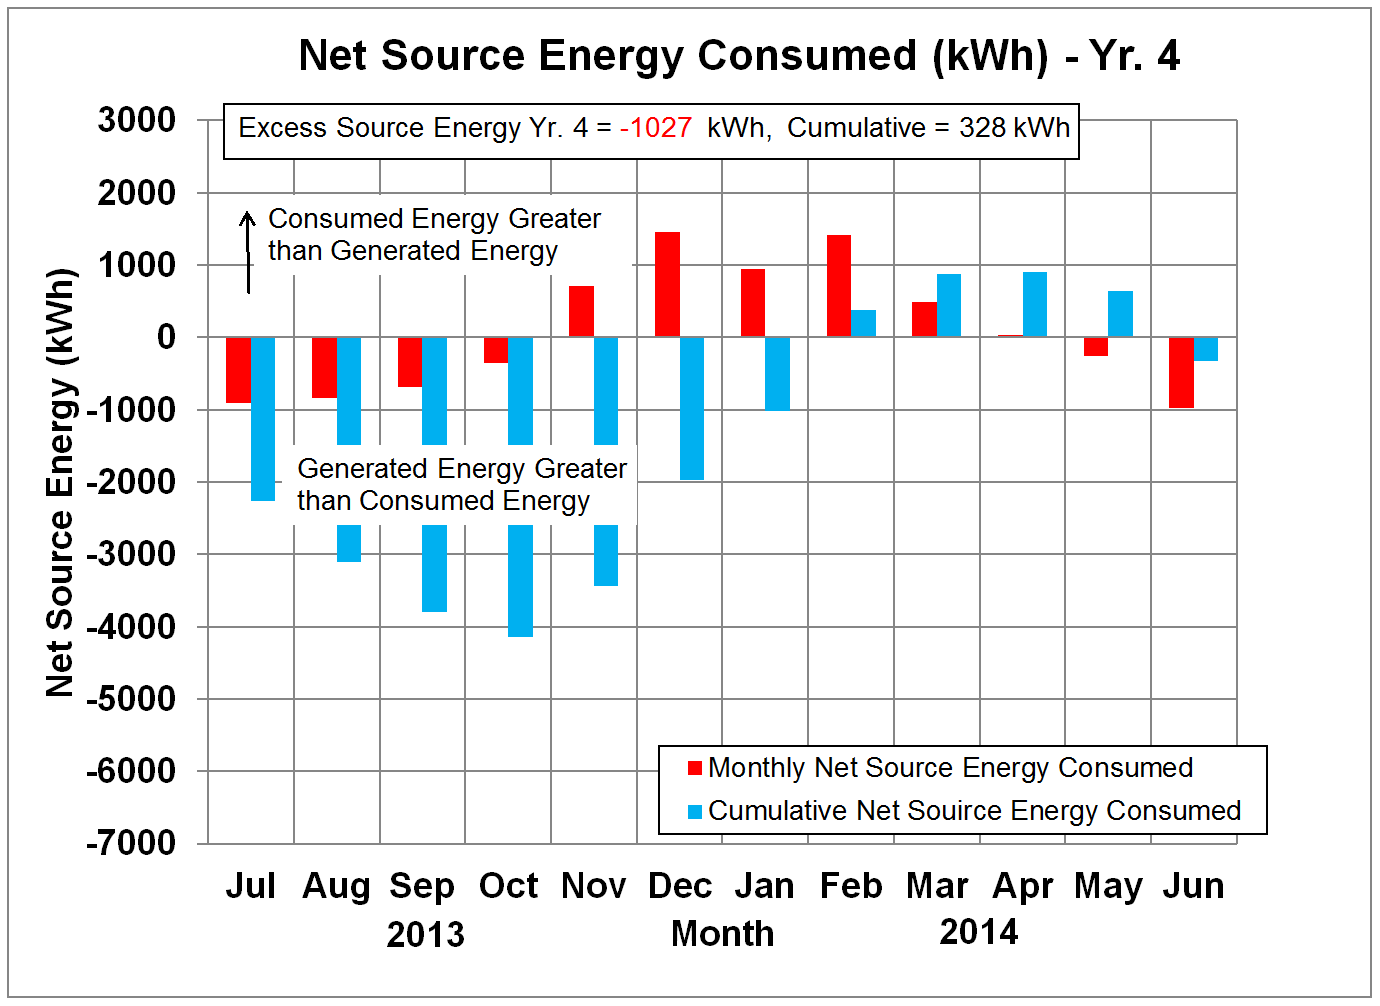
significantly colder than the previous two winters. After three
years, The Details Behind Source Energy
"Source energy" means evaluating energy use
including the energy used to drill, refine, generate, and/or transfer the
energy from the primary energy source to the house. Thus, for electricity, this starts with the
fuel that is burned to generate the electricity, a process that typically
requires about 2.5 times as much fuel energy as the electrical energy produced.
There are then significant resistance losses in the electric lines, with some
of the electrical energy converted to wasted heat energy. The U.S. Environmental Protection Agency
(EPA) has computed that over the whole United States, it takes on average
3.340 times as much primary energy as the amount of electrical energy that is
available at a house. This factor also
includes an accounting for electricity generated at nuclear plants and renewable
sources. Details are provided in the EPA
report "ENERGY STAR Performance Ratings, Methodology for Incorporating
Source Energy Use, August, 2009." A
link to this document is as follows: source energy details. The document contains the following table
that summarizes the source energy requirements for a variety of fuels.
In the Residential Energy Laboratory, the power sources are natural gas for space heating, domestic hot water heating (supplemental to solar thermal), and cooking, with electricity used for everything else. Electricity generated on site by photovoltaic (PV) panels is used to displace grid purchased electricity, so the source-site ratio of 3.340 is used. For natural gas, the source-site ratio of 1.047 is used. There is no wood-burning stove or other energy sources except for the solar thermal hot water system. |