As homes are built more carefully and with thicker walls and
higher insulation levels to reduce energy usage for heating and cooling,
windows can be the weak link in heat losses due to their low insulation
values. (Windows can also be a source of
significant solar heating, which in heating-dominated climates can be
important.) Heat losses through windows
can be reduced by increasing the number of window panes, by using spectrally
dependent coatings to reduce the thermal emissivity of the windows (“low-e”)
while maintaining good transparency, and by adding window coverings to reduce
heat losses. Window coverings can also
significantly reduce solar heat gains during times when a building must be
cooled.
Concerning window coverings for reducing heat transfer
through the windows, there is considerable interest in cellular shades that are
based on the concept of trapping a dead air space in a honeycomb-like structure
between the window and the interior of the building. In theory, this dead air space should provide
a fairly effective insulation layer within the window covering, and yet the
shades can be raised and the dead air space collapsed, making a compact storing
device. This report examines in detail
the insulating characteristics of cellular shades, and the effects on
insulating characteristics of light-filtering versus light-blocking shades, and
the effect of labyrinth seals along the edges of the shade to reduce air
circulation.
There
are standards for measuring heat transfer through windows, such as ASTM C1199 –
09e1, “Standard Test Method for Measuring the Steady-State Thermal Transmittance
of Fenestration Systems Using Hot Box Methods.”
The National Fenestration Rating Council (NFRC) also has recommended
procedures for determining heat transfer through windows such as NFRC 100-2010,
“Procedure for Determining Fenestration Product U-factors.
There do not appear to be standards for measuring heat
transfer rates, or their inverse, R-values, for window coverings. As a result, the
R-values for window coverings are essentially uncontrolled, and might be
exaggerated.
A report
was written by Steven Winter Associates, Inc. on the same type of shades tested
here, the ComforTrackTM Cellular Shades, except that only the
light-blocking shades were tested. This
report is available at Reference 1. They
report R-values of RSI = 0.16 (RUS = 0.9) without the
side seals, and RSI = 0.42 (RUS = 2.4) in tests using older,
single-pane, double-hung, wooden windows with exterior aluminum storm windows. Although the thermal resistance of the shades
should be independent of the window type, they report higher R-values when the
shades were tested with newer (2008), low-e, vinyl-framed, double-hung
windows. In the case of the newer, low-e
windows, they report R values without the side seals of RSI = 0.25 (RUS
= 1.4), and RSI = 0.77 (RUS = 4.4) with the side seals. However, it is shown in this report that the
results by Steven Winter Associates were in error and biased toward higher
R-values by the approach used to process the measurements, as discussed below
in the section titled Test Procedure.
In some
advertising, e.g., Reference 2, even slightly higher R-values than those in the
Steven Winter report are presented. Since
there are no standards for measurements of thermal resistance for window
coverings, advertisers appear to use a lack of restraint in coming up with
R-values for their products.
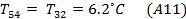
The window shades tested were
Symphony® 9.5 mm (3/8”) double-cell cellular shades with Comfortrack™ Plus side
seals, and they were manufactured by Comfortex.
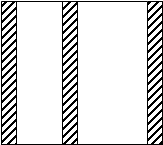
The double-cell structure can be seen in Figure 1 below. There
is a slot between the two rows of cells, and the labyrinth side seals fit into
that slot. The side-sealing system is
shown in Figure
2 below, and includes the plastic projection that
penetrates the gap between the two rows of cells, and a Z-shaped polymer gasket
that expands to fill the gap between the side of the window frame and the outer
half of the shade. The overall system as
installed is shown in Figure
3 and Figure
4. Note that for
air to circulate around the sides of these shades, the air must penetrate the
gap between the Z-shaped polymer spring material and the row of cells closer to
the window in the shades, and then must penetrate the labyrinth piece that fits
between the two rows of cells. This
sealing system is shown in these tests to dramatically increase the insulating
capabilities of these shades. The side
seals are held to the frame of the windows magnetically, and are easily
removable, as they were for some of the tests reported here without side seals.
The thermal insulating characteristics of two types of
cellular shades, light-filtering and light-blocking, were measured under actual
operating conditions. The light-blocking
shades incorporated something like aluminum foil in their construction to block
the light. The shade material in the
light-blocking shades was stiffer than the material in the light-filtering
shades, making them more difficult to lower, usually requiring manual
assistance to get them all the way down.
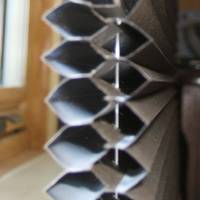
Figure 1. Side View of Double-Cell Structure of
Cellular Shades. Slots for Side Seals are in Same Plane as
Cord.
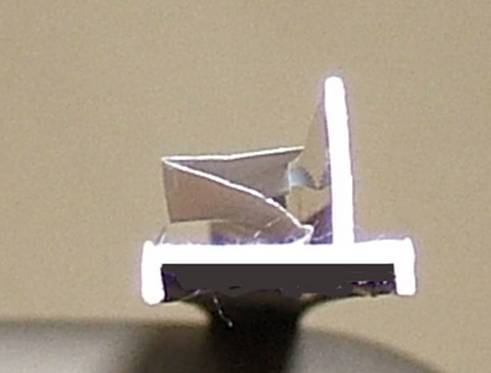
Figure 2. Side Seals of ComforTrack™ Plus System
showing the Z-shaped Polymer Gasket.
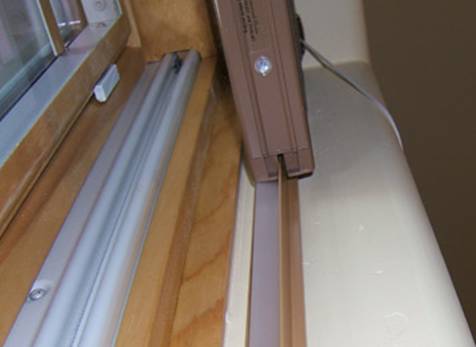
Figure 3. ComforTrack™ Plus Shades with Side Seals in
Place.
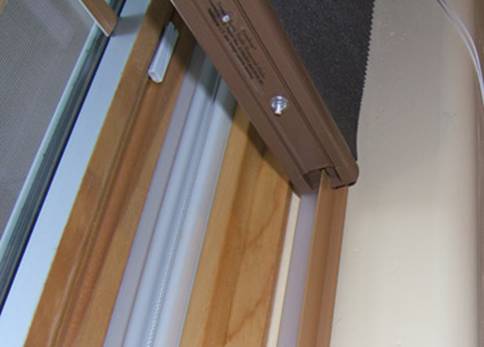
Figure 4. Another View of ComforTrack™ Plus Shades with
Side Seals.
The windows used in the testing are important since the
R-value for the shades is computed based on the R-value for the windows and the
relative temperature drops across the windows and the shades. The windows used in this study were
relatively new (2010) Pella Designer windows that are low-e (low infrared
emissivity), triple-pane windows. Rather
than having all three panes in one insulated glass unit, these windows use two
panes in an insulated glass unit, and the third pane, toward the inside of the
house, has its own sealing surface. This
design is used to allow the inner pane to be tilted inward and optional mini-blinds
to be installed between the inner pane and the outer two panes. (Mini-blinds are not a part of the windows
that were tested.) Both low solar gain
and high solar gain windows are installed in the house, and some of the testing
was conducted on both types of windows.
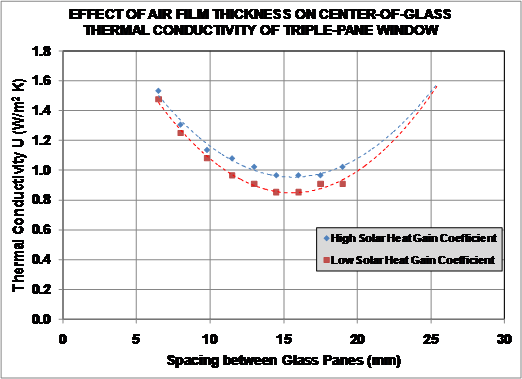
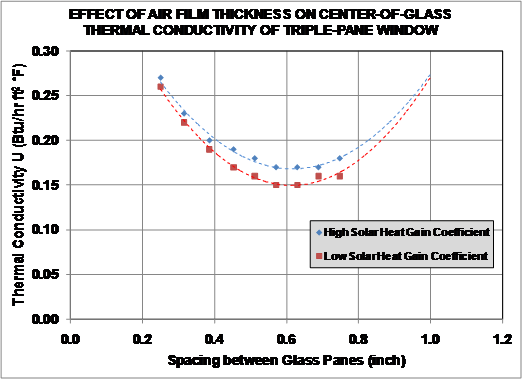
The low solar gain windows have a thermal conductivity specified at 1.65
W/m2 ˚C (0.29 Btu /ft2 ˚F hr), corresponding to an
R-value of RSI = 0.61 (RUS = 3.4). The thermal conductivity of the high solar
gain windows is slightly higher (i.e., thermal resistance lower), being
specified as 1.76 W/m2 ˚C (0.31 Btu /ft2 ˚F hr),
corresponding to an R-value of RSI = 0.57 (RUS= 3.2). The higher thermal conductivity for the high
solar gain windows is due to the higher long-wavelength infrared emissivity of
these windows that results from changing the coating to allow more short-wavelength
infrared solar energy to enter the home.
All of the windows used for these tests were of the same
size, and all measured 1.04 m (41”) W x 1.50 m (59”) H (rough opening
dimensions). Five windows were used for
these tests, two with low solar heat gain (#1 and #2), and three with high
solar heat gain (#9, #13, and #15). The
experimental results presented below use these window numbers. All windows were closed and locked for these
tests. All testing was done when no sun
was shining on the window being tested.
Most tests were conducted early in the morning about the time that the
outside temperature reached a minimum, and when the indoor, outdoor, and shade
temperatures were well stabilized. Winds
are typically low during this period.
Temperature measurements were made with “1-wire” T-Sense™
temperature sensors obtained from iButtonLink.
A sensor is shown in Figure
5. Dimensions
are 44.5 mm L x 19.1 mm W x 19.1 mm H (1-3/4"L x 3/4"W x 3/4"H). The actual temperature sensor is located 9.5
mm (3/8”) from each edge of the device. These sensors can be strung together using a
pair of wires in a cable and RJ45 connectors on each end of the sensors. These temperature sensors are interfaced with
a personal computer through a DS1401 adapter, and OneWireViewer software is
used to display and plot results.
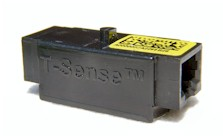
Figure 5. T-Sense Temperature Sensor from iButtonLink. Temperature Sensor is in the Nipple on Top of
Sensor in this Picture.
For
all of the temperature measurements reported here, four sensors were attached
to the inside of the windows, one sensor each located near the center of the
top and bottom panes, and one each near the edges of the top and bottom panes,
as shown in Figure
6. The sensors
were mounted such that the temperature sensing elements were 9.5 mm (3/8”) toward
the room side from the inner surface of the innermost glass pane (surface #6 in
the standard parlance used to number window panes from outside to inside). The four readings were averaged together to
get a single value for the air temperature between the window and the
shade.
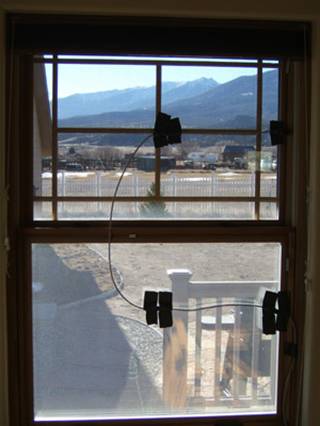
Figure 6. Location of the Four T-Sense™ Temperature
Sensors on each Window.
Outside temperatures were computed from an average of two
liquid thermometers, with their average temperature reading averaged together
with a solid state temperature sensor.
Inside temperatures were taken from a solid state temperature sensor
located in the thermostat.
The approach used to measure the thermal resistance
(R-value) of the window shades was to measure air temperatures outside and
inside the house, and between the windows and the shades. Then the R-values of the windows were taken
as known values, and the R-values of the shades were solved for based on the
temperature measurements. This approach
is similar to that used by Steven Winter Associates, but the mathematical
analysis was different. This approach
does depend on knowing the R-values of the windows accurately, and for that
reason, tests were conducted on multiple windows for each type of window shade
(light-filtering and light-blocking) to average out window-to-window
variability.
In agreement with the assumption made by Steven Winters
Associates, the heat flow through the window and the heat flow through the
shade are taken as equal. Said another
way, the main heat flow is through the window and shade, and not in or out into
the window frame. The heat flux density
through the window is written as:

where:

Uwindow = Thermal Conductivity of Window (W/m2
˚C)
Tshade = Air temperature between the window and the
shade (˚C)
Tout = Outside temperature well away from the window
(˚C)
Since the thermal conductivity
of the windows is known (from the window specifications), and the temperatures
can be measured, then the heat flux through the window can be computed. From the above section on windows, the
U-value for the low solar gain windows is 1.65 W/m2 ˚C (0.29 Btu/ft2
˚F h), and for the high solar gain windows is 1.76 W/m2 ˚C (0.31
Btu/ft2 ˚F h)
Now if the heat flux density through the window is equal
to the heat flux density through the shade, then,

and similarly to the equation
for heat flux density though the window,
where:

Ushade = Thermal conductivity of shade (W/m2
˚C)
Tin = Inside temperature well away from the window and
shade (˚C)
Tshade =Air temperature between the window and the shade
(˚C)
Since by definition the
thermal resistance R is the inverse of the thermal conductance U, then,
Then Eq. (3) may be
rearranged using Eq. (4) as,
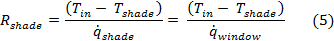
and substituting for  from Eq. (1),
Now Eq. (6) makes sense. If the shade is highly insulating compared to
the window, then most of the temperature drop will across the shade, i.e.,  will be large compared to
 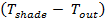 , and
, and  will be larger than
  in
agreement with Eq. (6).
in
agreement with Eq. (6).
The problem with Eq. (6) is in measuring Tshade that turns out to be
far from uniform, as will be shown below, and cannot be measured far from the
window where the temperature is out of the boundary layer. Tin
and Tout may be measured
far from the window/shade assembly where they are constant, but Tshade is necessarily defined
in the small region between the window and the shade where the air temperatures
are in the boundary layers for both the window and the shade, and are not
constant. The problem is most clearly
demonstrated by example.
Imagine a shade made of a few paperclips, or some other
imaginary shade with no insulating value.
The imaginary shade may be simulated by simply raising the cellular shade
all the way up. Then temperature data
may be recorded with the shade raised, and the thermal resistance, Rshade, value better be zero
for the imaginary shade. However, using
actual experimental data inserted into Eq. (6), the value for Rshade is not zero due to
this boundary layer effect. The R-value
computed for the imaginary shade, R_imag, is shown in Table 1 in SI units, and in Table 2 in United States units. The “shade temperatures” were measured 9.5
mm (3/8”) from the window surface of window #15 (a high solar gain window), and
these temperatures were significantly lower than the indoor temperature
measured away from the windows. On
average, the R-values for the imaginary shade were about 10% of the R-value for
the window.
Table 1. RSI for
Imaginary Shade Computed from Eq. (6), Column R_imag, on a Window with RSI
= 0.56.
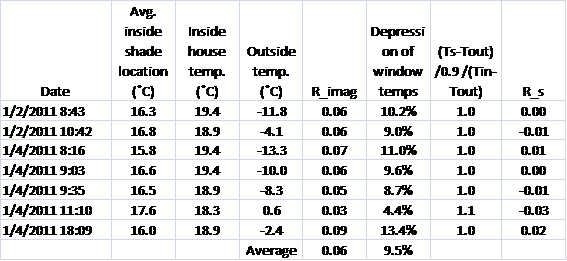
Table 2. RUS for Imaginary Shade
Computed from Eq. (6), Column R_imag, on a Window with RUS = 3.2.
The boundary layer problem is quantified in Figure 7 (in degrees Centigrade) and Figure 8 (in degrees Fahrenheit). Note the position of the shade relative to
the lower window. The total gap between
the inner window surface and the shade is about 30 mm (1.2”), and there are
strong temperature gradients when no shade is present out to well beyond 100 mm
(4”). Therefore, there is a temperature
differential between the shade temperature and the inside house temperature
even with no shade present. As shown in Table 1 (and Table 2 in United States units), the temperature
differential between the outdoor and shade temperature was about 9.5% lower
than temperature differential between the outdoor and the indoor
temperatures. The heat conduction
through the window should be computed based on the differential between the
outdoor and indoor temperatures. When
the shade is present, only the shade temperature is available to compute the
differential temperature. An approximate
correction when using the shade temperature to represent the indoor temperature
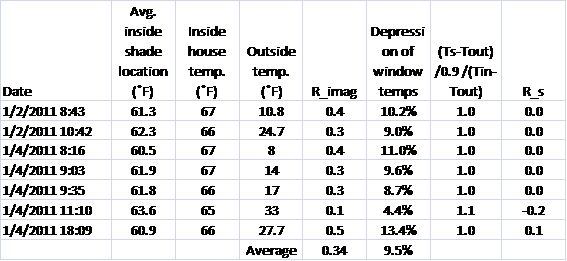
is to divide by 0.9, that is, 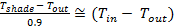 . In
fact, the column in Table
1 and Table 2 with this label shows that for these
experimental measurements, this ratio is always close to unity, and therefore,
this is a good approximation for estimating the total temperature differential
across the window if more room were available between the window and the
shade. The revised calculation of the
R-value for the imaginary shade is shown in the column labeled R_s, and it is
essentially zero as it should be for an imaginary shade. This same approach was used for temperature measurements
when the shade was present to correct for the boundary layer effects.
. In
fact, the column in Table
1 and Table 2 with this label shows that for these
experimental measurements, this ratio is always close to unity, and therefore,
this is a good approximation for estimating the total temperature differential
across the window if more room were available between the window and the
shade. The revised calculation of the
R-value for the imaginary shade is shown in the column labeled R_s, and it is
essentially zero as it should be for an imaginary shade. This same approach was used for temperature measurements
when the shade was present to correct for the boundary layer effects.
Are the measured temperature differences in the inside
air film shown in Figure
7 (or Figure 8 if the preference is for US units) reasonable? This question is addressed in the Appendix
where the temperature differences across different parts of the window,
including the air film on the inside and outside of the window, are examined
from a theoretical heat transfer perspective.
The results presented in Appendix A show that a significant temperature
difference between the inside window temperature and the room temperature is
expected, and the magnitude of that theoretical temperature difference is
similar to that shown in Figure
7.
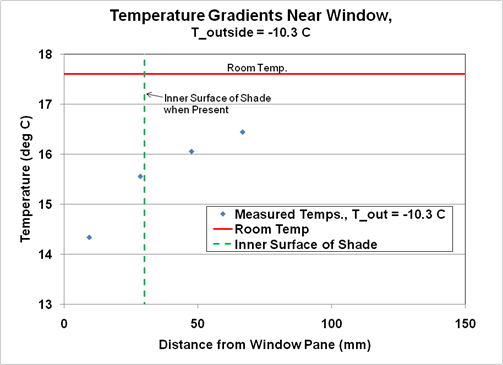
Figure 7. Temperature Gradient in Degrees Centigrade Measured
Near Window when Shade is Fully Raised using a Stack of T-SenseTM
Sensors at an Outdoor Temperature of -10.3˚C.
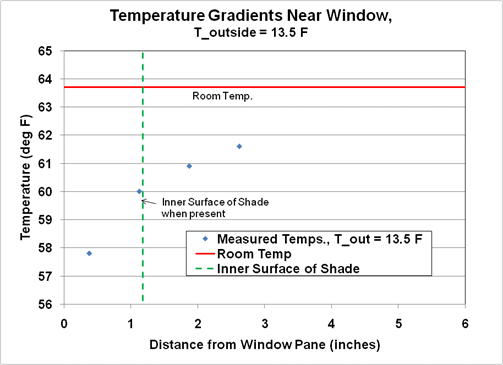
Figure 8. Temperature Gradient in Degrees Fahrenheit
Measured Near Window when Shade is Fully Raised using a Stack of T-SenseTM
Sensors at an Outdoor Temperature of 13.5˚F.
Measurements were made on five different windows, two
with low solar gain coatings (#1 and #2), and three with high solar gain
coatings (#9, #13, and #15).
Light-blocking shades were mounted on windows #1, #2, and #9, while
light-filtering shades were mounted on windows #13 and #15. For each window/shade combination, tests were
conducted with the side seals in place, and with them removed. Data were acquired on a number of days to get
a range of outdoor temperatures.
Results for the R-values for the light-filtering shades
on two different nominally identical windows, both with the side seals in place
and removed, are shown in Figure 9 for RSI (in units of m2
˚C/W), and in Figure 10 for RUS (in units of ft2 ˚F
h/Btu). Excellent repeatability is shown
between results for the two different windows and shades. There is an unexpected trend that shows the
thermal resistance values decreasing with decreasing temperatures down to about
-6˚C (21˚F), and then more constant values at lower temperatures. This temperature dependence could be due to a
variation in the thermal resistance (R-value) for the window with temperature,
or a temperature-dependence for the shade.
It was assumed that the thermal resistance for the window was
independent of temperature, and that the measured variation with temperature
was due to an actual variation in the thermal resistance of the shade, likely
due to increased convection at greater temperature differentials.
The results in Figure
9 and Figure
10 (same results in two different units of measure) show
that the side seals perform as they were designed to perform, dramatically
reducing the convective heat transfer from the window to the room. As a result, the R-value is approximately
doubled with the addition of the side seals.
To specify the numerical R-value for the shades, it is necessary to
choose an outdoor temperature at which the measured values should be
chosen. There is no measurement standard
for determining the thermal resistance of window coverings. The National Fenestration Rating Council
(NFRC) also has recommended procedures for determining heat transfer through
windows such as NFRC 100-2010, “Procedure for Determining Fenestration Product
U-factors. For simulations, they
recommend using temperatures as follows: an interior ambient temperature of
21.0˚C (69.8˚F) and an exterior ambient temperature of -18˚C (-0.4˚F). This specified interior temperature is close
to what was used in this testing, which averaged about 19˚C (67˚F). However, the exterior temperatures for these
tests were greater than that specified above of -18˚C (-0.4˚F). For this work, the temperature at which the
R-values were specified was -7˚C (20˚F).
At this temperature, the R-values were fairly constant, and this is a
more representative average winter-time temperature in the U.S. than the NFRC
value of -18˚C (-0.4˚F).
At an outdoor temperature of -7˚C (20˚F), the R-value for
the light-filtering shades without side seals was RSI = 0.10 (RUS
= 0.57), while the addition of the side seals more than doubled the R-value to
RSI = 0.21 (RUS = 1.2).
At higher outdoor temperatures, the R-values were significantly greater;
that is, the shades were better insulators at higher outdoor temperatures.
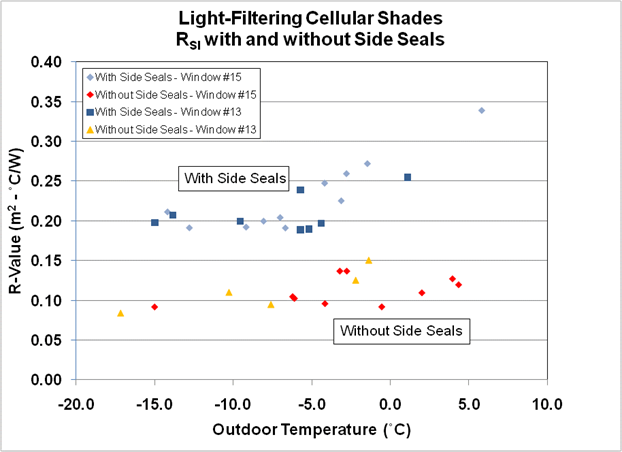
Figure 9. RSI Measured for Light-Filtering
Shades for Two Nominally Identical Windows, both with and without the Side
Seals.
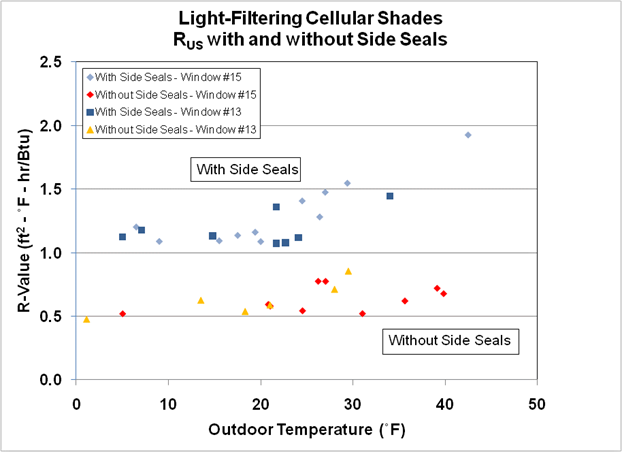
Figure 10. RUS Measured for Light-Filtering
Shades for Two Nominally Identical Windows, both with and without the Side
Seals.
Thermal resistance values for the
light-blocking shades were made, both with and without side seals, on three
different windows, #1, #2, and #9, where the first two were low solar gain
windows and the third was a high solar gain window. Results for R-value in metric units (RSI)
are shown in Figure
11, and in US units (RUS) are shown in Figure 12. Repeatability for measured R-values without
the side seals was excellent between the three windows. R-values with the side seals showed more
scatter, presumably due to differences in the fit for the side seals. For the light-blocking shades without side
seals, the R-value at an outdoor temperature of -7˚C (20˚F) was RSI
= 0.13 (RUS = 0.74), while adding the side seals more than doubled
this value to RSI = 0.35 (RUS = 2.0). Thus, the light-blocking shades were
significantly better insulators than the light-filtering shades, and adding the
side seals almost tripled the R-values for the light-blocking shades.
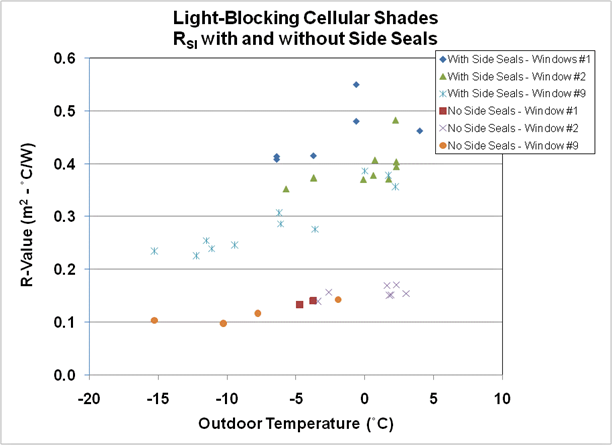
Figure 11. RSI Measured for Three Different
Windows (Two Low Solar Gain, #1 and #2, One High Solar Gain, #9) for
Light-Blocking Shades, both with and without Side Seals.
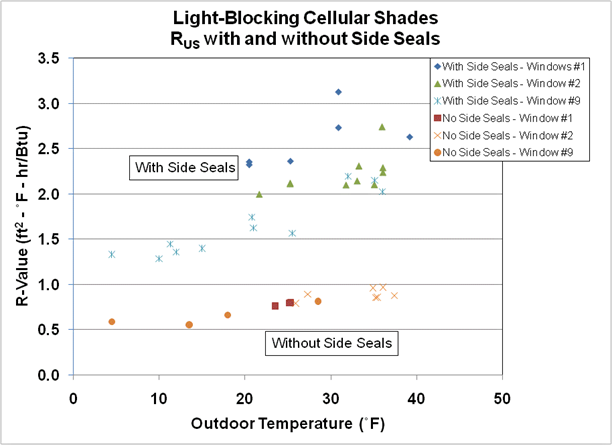
Figure 12. RUS Measured for Three Different
Windows (Two Low Solar Gain, #1 and #2, One High Solar Gain, #9) for
Light-Blocking Shades, both with and without Side Seals.
From the test results above, the light-blocking shades
are clearly superior to the light filtering shades in terms in insulating
properties, having roughly 50% higher R-values.
However, the choice between these two types is often based on color
choice, or the desire for the amount of light to allow into the room during the
daytime, rather than insulating properties.
Another factor to consider is that the light-blocking shades are
apparently made by adding a layer of aluminum foil to the blinds. This makes the blinds stiffer to raise and
lower, with lowering the shade often requiring use of the second hand to pull
the shade to the completely closed page.
Another interesting characteristic of the light-blocking shades is that
they take a few minutes to completely straighten out all the folds, and in the
process of straightening out, they crackle for five minutes or so. The light-blocking shades are more expensive
than the light-filtering shades, $121 versus $93 for the size shades tested
(without side seals), or 30% more.
The side seals were very effective in reducing the
convective flow across the windows. The
air flow is the reverse of a hot radiator, and is shown in Figure 13. This airflow pattern is supported by the
infrared thermal image shown in Figure 14
that shows warmer colors toward the upper part of the window. Further, the average temperatures measured by
the sensors near the midline of the top window pane were 1.8˚C (3.2˚F) higher
than temperatures measured near the midline of the bottom window pane. This reduction in convective airflow resulted
in increasing the R-value for the cellular shades by a factor of two or
more. It also increased the time
required to install the shades by about a factor of two. Further, adding the side seals increased the
cost of the shades by $42 in the size tested.
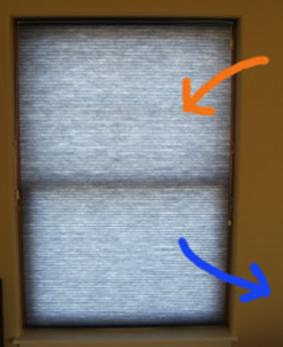
Figure 13. Convective Airflow across Window from Top to
Bottom with Cold Exterior Temperatures, the Reverse of the Flow across a Hot
Radiator.
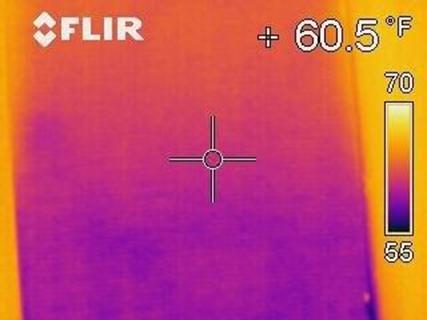
Figure 14. Infrared Thermal Image of Window from
Previous Figure Showing Warm Air at the Top, Cooler Air toward the Bottom,
under Conditions of Cold Outside Air.
These prices for cellular shades are too high to justify
their purchase based solely on energy savings when they are used with low-e,
triple pane windows. However, many
people like to use window coverings for privacy, style, or to avoid sun damage
to furnishings, and these cellular shades, especially with the side seals,
offer a significant boost in insulating value for the window/shade combination. Windows in new homes in cooler climates in
the United States require the thermal conductivity to be lower than 2.0 W/m2
˚C (0.35 Btu/h ft2 ˚F), corresponding to a minimum RSI of
0.5 (RUS = 2.9). Thus, the
R-values of these shades can be significant relative to the R-value for the
windows alone, increasing the R-value for the combination of window plus shade
by up to 70% (for light-blocking with side seals) over a window alone that
meets the new minimum code requirements for new construction. For older windows, the improvement would be
even more significant. For a single-pane
window with an RSI of about 0.16 (RUS = 0.9), the
combination of the window plus shade would give an R-value of up to 422% that
of the window alone (for the light-blocking shade with side seals). In addition to the energy savings, these
shades with the side seals increase the comfort level in the house, reducing
radiation losses to the cool window surfaces, and reducing convective air
currents near the windows.
How do the results reported here compare with previous
results reported in the Steven Winter Associates report? Their results were only for the
light-blocking shades, so comparisons should be limited to the corresponding
shades tested here. Steven Winter
Associates reported different results for R-values for the shades tested on
single pane windows with an exterior storm window compared to results for newer
low-e, double pane windows, while the shades should have the same R-value. Averaging their results for the two windows,
without the side seals RSI = 0.20 (RUS = 1.1), while with
the side seals they report RSI = 0.60 (RUS = 3.4). The corresponding results reported here were
RSI = 0.13 (RUS = 0.74) without side seals, and RSI
= 0.35 (RUS = 2.0) with side seals.
So the R-values results reported here are significantly lower than those
reported by Steven Winter Associates, with the results as shown in Table 3 in SI units and Table
4 in US units.
Table 3. Comparison of RSI
for Cellular Shades with and without Side Seals as Measured by Steven Winter
Associates, LLC and in this Report.
|
|
RSI,
Steven Winter, 0.8˚C
|
RSI,
This report, -7˚C
|
|
Shades without side seals
|
0.20
|
0.13
|
|
Shades with side seals
|
0.60
|
0.35
|
Table 4. Comparison of RUS for
Cellular Shades with and without Side Seals as Measured by Steven Winter
Associates, LLC and in this Report.
|
|
RUS,
Steven Winter, 33˚F
|
RUS,
This report, 20˚F
|
|
Shades without side seals
|
1.1
|
0.74
|
|
Shades with side seals
|
3.4
|
2.0
|
The differences in reported R-values may be traced to two
factors. First, Steven Winter Associates
did not correct for the boundary layer effect discussed in the TEST PROCEDURE
section above. Secondly, the Steven
Winter data are for a higher temperature than the -7˚C (20˚F) “standard”
temperature chosen for these results.
Assuming that the data taken by Steven Winter Associates were roughly
the same distance from the window surface as the results reported here, then their
data may be roughly corrected by subtracting out the R-value that they would
have measured for an imaginary shade using their approach, as shown in Table 5 in RSI units, and in Table 6 in RUS units. This would mean that 0.06 should be
subtracted from their RSI values, and 0.34 from their RUS
values. The temperature range for data
taken by Steven Winter Associates was quite narrow, but data are shown in this
report for a range of temperatures.
Therefore, it is possible to examine results shown in Figures 11 and 12
corresponding to their average outdoor temperature of 0.8˚C (33˚F). In Tables 5 and 6 (for RSI and RUS
units, respectively), data from this report are shown for the same temperatures
as those used by Steven Winter Associates.
Further, the Steven Winter data have been corrected for the boundary
layer effect. Within the scatter of the
data, the Steven Winter data, after correction for the boundary layer error,
agree fairly well with those reported here.
Before correction, the Steven Winter data appear to be biased toward
higher R-values than the “true” due to the boundary layer effect in their
measured temperatures.
Table 5. Comparison of RSI
for Cellular Shades with and without Side Seals as Measured by Steven Winter
Associates and Corrected for Boundary Layer Effect, and in this Report at the
Same Test Temperature (0.8˚C).
|
|
RSI corrected,
Steven Winter, 0.8˚C
|
RSI,
This report, 0.8˚C
|
|
Shades without side seals
|
0.14
|
0.16
|
|
Shades with side seals
|
0.54
|
0.43
|
Table 6. Comparison of RUS for
Cellular Shades with and without Side Seals as Measured by Steven Winter
Associates and Corrected for Boundary Layer Effect, and in this Report at the
Same Test Temperature (33˚F).
|
|
RUS
corrected, Steven Winter, 33˚F
|
RUS,
This report, 33˚F
|
|
Shades without side seals
|
0.80
|
0.91
|
|
Shades with side seals
|
3.1
|
2.4
|
A disadvantage of insulating window coverings of any type
is that they lower the inside glass temperature during the heating season,
increasing the chances of condensing water on the window surface. The addition of the side seals reduces the
window temperature more than the shades without side seals, but it also reduces
the convective airflow across the surface.
The reduced window temperatures tend to increase condensation, but the
reduced convective airflow should reduce condensation. Thus, the moisture condensation could be increased
or decreased by the presence of the side seals.
The effect of side seals on condensation rates was not studied in this
work. Condensation temperatures may be
calculated as a function of interior relative humidity by using the calculator
at Reference 3. A way to avoid the
condensation issues is to use shutters outside the house rather than
inside. Opening and closing external
window coverings can be an issue in areas with snow and ice, and usually
requires more effort than closing inside shades.
The addition of side seals to cellular shades increases
the insulating values of the shades by a factor between two and three. The side seals also reduce light leakage
around the edges of the shades.
Light-blocking cellular shades have significantly greater insulating
values than light-filtering shades, although the choice between the two is
usually based on color choice and desire for amount of light to penetrate the
shades rather than insulating characteristics.
An outside temperature of -7˚C (20˚F) was chosen as a
“standard” temperature at which to quantify the thermal resistance (R-value)
for the shades. Indoor temperatures were
maintained at about 19˚C (67˚F). At these
conditions, the R-value for the light-filtering shades without side seals was RSI
= 0.10 (RUS = 0.57), while the addition of the side seals more than
doubled the R-value to RSI = 0.21 (RUS = 1.2). For the light-blocking shades without side
seals, the R-value at an outdoor temperature of -7˚C (20˚F) was RSI
= 0.13 (RUS = 0.74), while adding the side seals almost tripled this
value to RSI = 0.35 (RUS = 2.0). At higher outdoor temperatures, the R-values
increase dramatically. These insulating
values are significant compared to the insulating values for windows alone, so
the addition of this type of window coverings can significantly reduce heat
losses in a home. During the cooling
season, the shades can block most of the thermal energy that would enter the
home through the windows, although this effect was not studied for this report.
This
work was funded by internal research funds from the Residential Energy
Laboratory.
Reference 1. http://www.comfortex.com/_/documentGallery_/CARBwindow_shade_report.pdf.
Reference 2. http://blindalley.com/portfolios/hunterdouglas/portfolioslarge/duetteenergyefficiency.html)
Reference 3. http://www.builditsolar.com/References/Calculators/Window/condensation.html
The heat transfer between the
room air and the inner window surface may be assumed to be driven by natural
convection, and the heat transfer coefficient, h, is given by (for example, Ref. A-1),
Now expressions have been given above for all the heat fluxes
through the window system shown in Fig. A-1, but the temperature drops in each
section are unknown. Some constraints
must be set to solve the simultaneous equations for heat transfer. First, the conditions of interest are for
those conditions where the R-values have been determined, and those “standard”
conditions are an indoor temperature of 19.4˚C (67˚F), and an outdoor temperature
of -6.7˚C (20˚F), or a total differential temperature of 26.1˚C (47˚F). As stated above, it is assumed that the heat
transfer rates through each section shown in Fig. A-1 are the same, so that
heat transfer to the edges of the window are ignored. This means that,
Reference A-3. Bird, R.B., Stewart, W.E., and Lightfoot, E.N., Transport
Phenomena, Wiley, New York, 2007.