ResidentialEnergyLaboratory.com
Links:Home Page
House Construction Details
Net Energy Use
Energy Use Details
Costs and Payback for Net-Zero
Infrared Images of REL
Energy Efficient Design
Comparison of PV Systems
R-Value of Cellular Shades
Energy Codes for Windows
Solar PV Raw Data
Related Links
About Us
Contact
Site Map
| Energy Use Details - Performance of Solar Photovoltaic SystemAt this location in sunny Colorado, the yearly average
solar radiation on a flat plate collector aimed due south and tilted at
an angle equal to the latitude is 5.78 kW/m2/day. Therefore, sunlight is a plentiful energy resource available to all. The
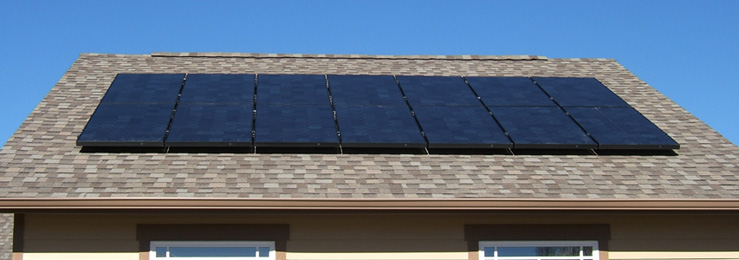
solar photovoltaic system is pictured below, and is
rated at 3.15 kW DC. It consists of 14 panels rated at 225 W DC
each. They are mounted on the garage/workshop on a roof with a
pitch of 6/12, corresponding to a tilt angle from horizontal of 26.6°.
The house is located at a latitude of 38.6°. If the garage
had been constructed at a 9/12 pitch, the corresponding tilt angle
would be 36.9°, very close to the latitude of 38.6°,
which would have improved solar PV efficiency, but the taller roof
would have degraded the passive solar energy collection by the house
since the garage/workshop is detached and southeast of the house.
Plus, as the builder pointed out, the roof would have dwarfed the
garage. The slight loss in collection efficiency due to the non-ideal
orientation is discussed below.
Calculations
of predicted power by the PV system were made using PVWatts 2.0
for the actual panel orientation over the year, and those results are
compared with the measured values for the period that the PV
system has been in operation, with the results as shown in the figures below.
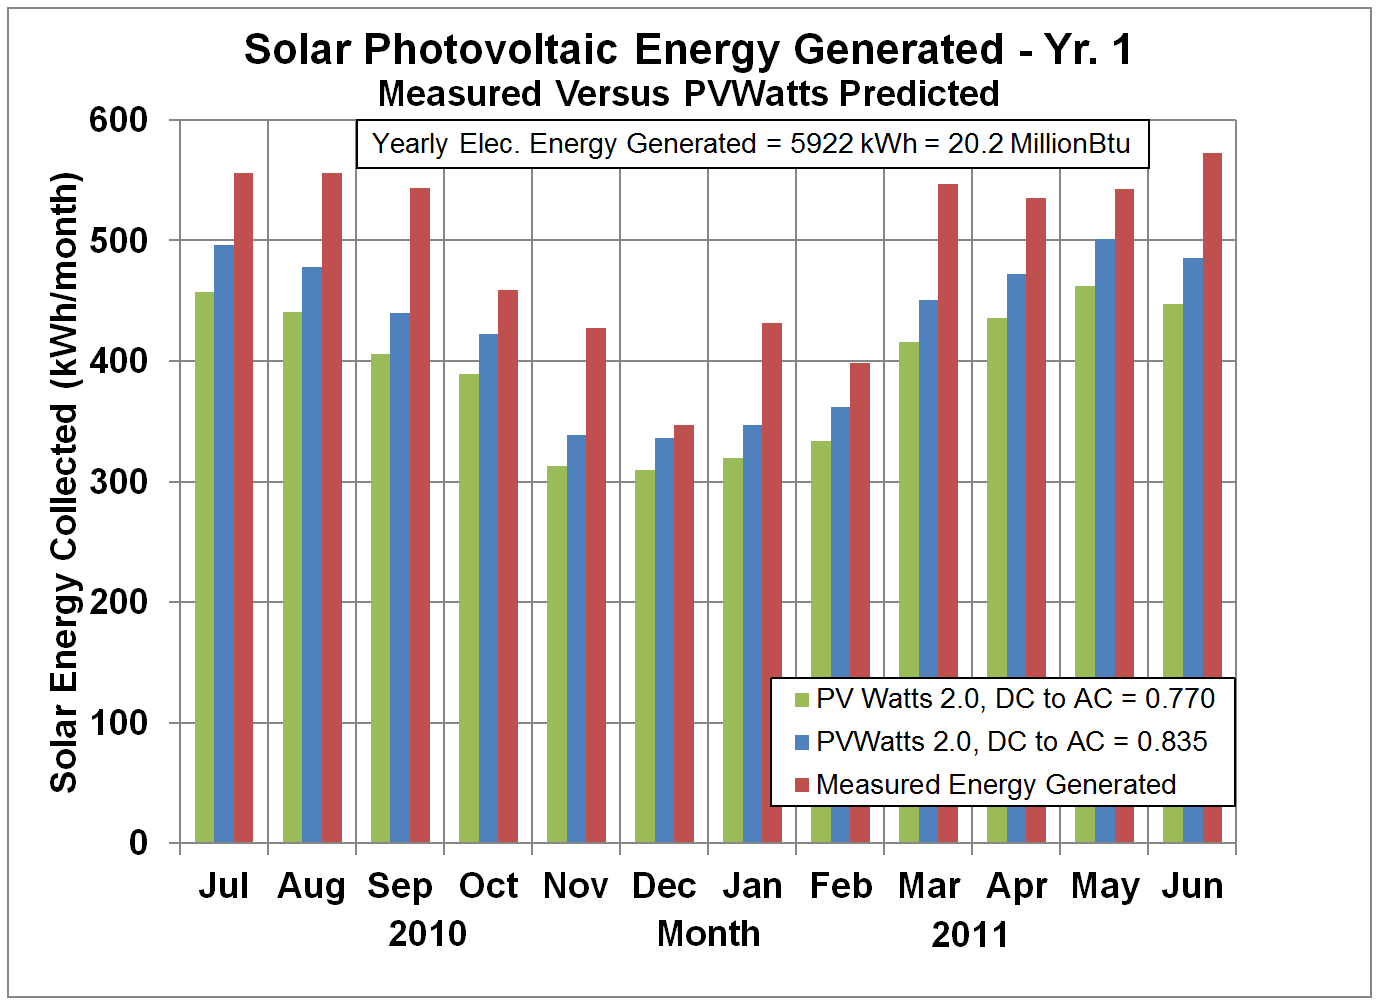
The
initial predictions for PV energy generation were using the PVWatts
default factor of 0.77 for conversion of DC power at the panels to AC
power at the lines. However, measured energies were considerably
in excess of the predicted energies. The PV system installer
pointed out that the panel manufacturer suggested a factor of 0.835 rather than 0.77 (see Table below for details), and the calculations were repeated with that factor.
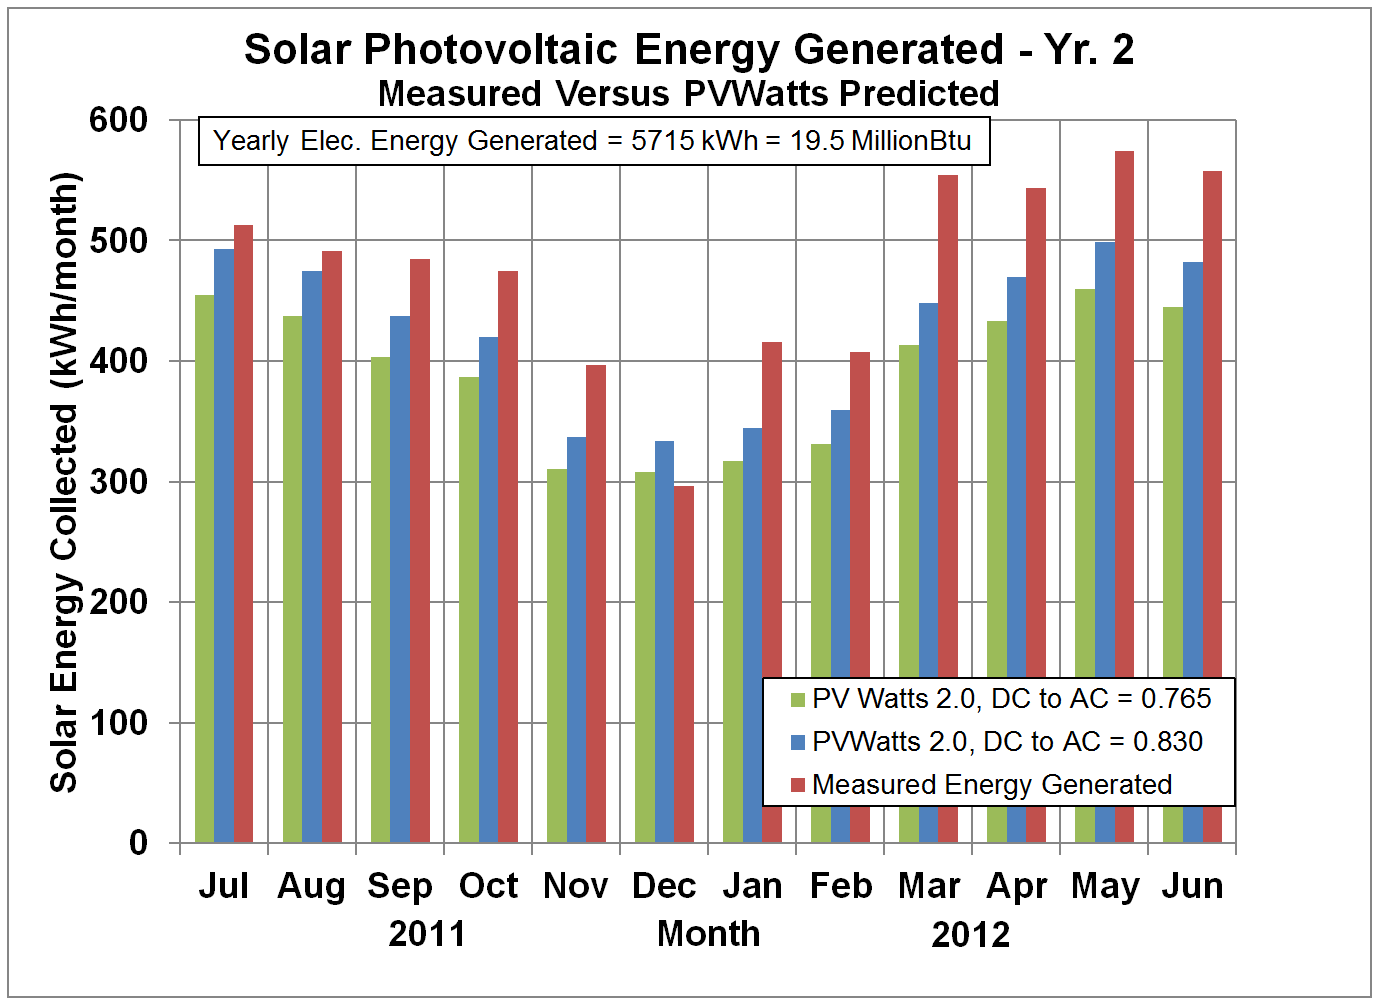
Even with the derate factor of 0.835, the PV system appeared to
produce more than the predicted energy as shown in the figures above.
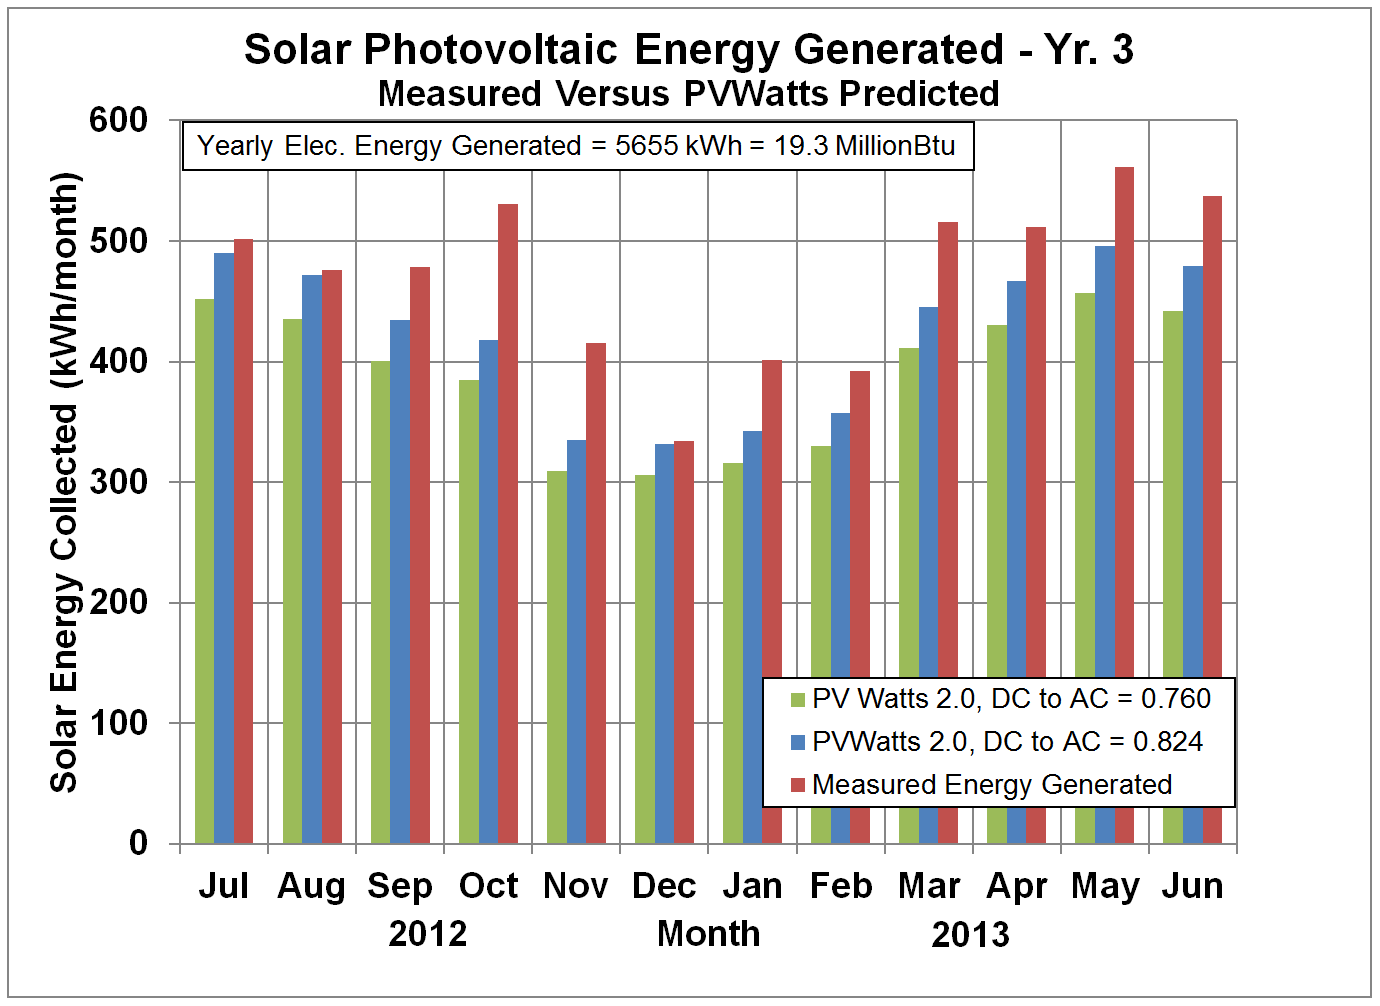
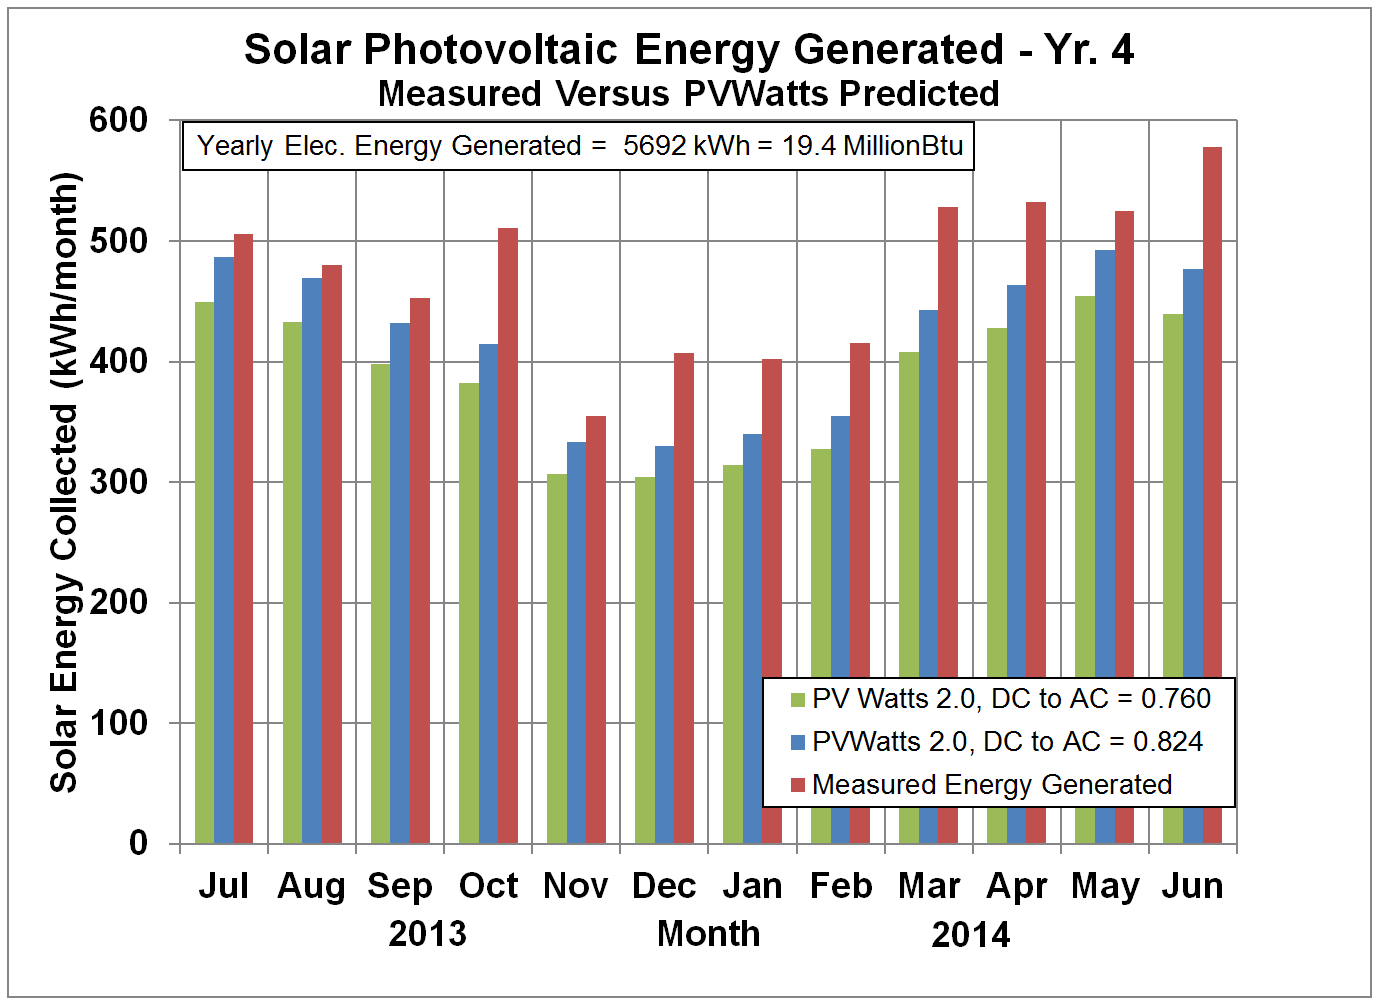
The calculated energy will continue to be compared with the
measured energy.
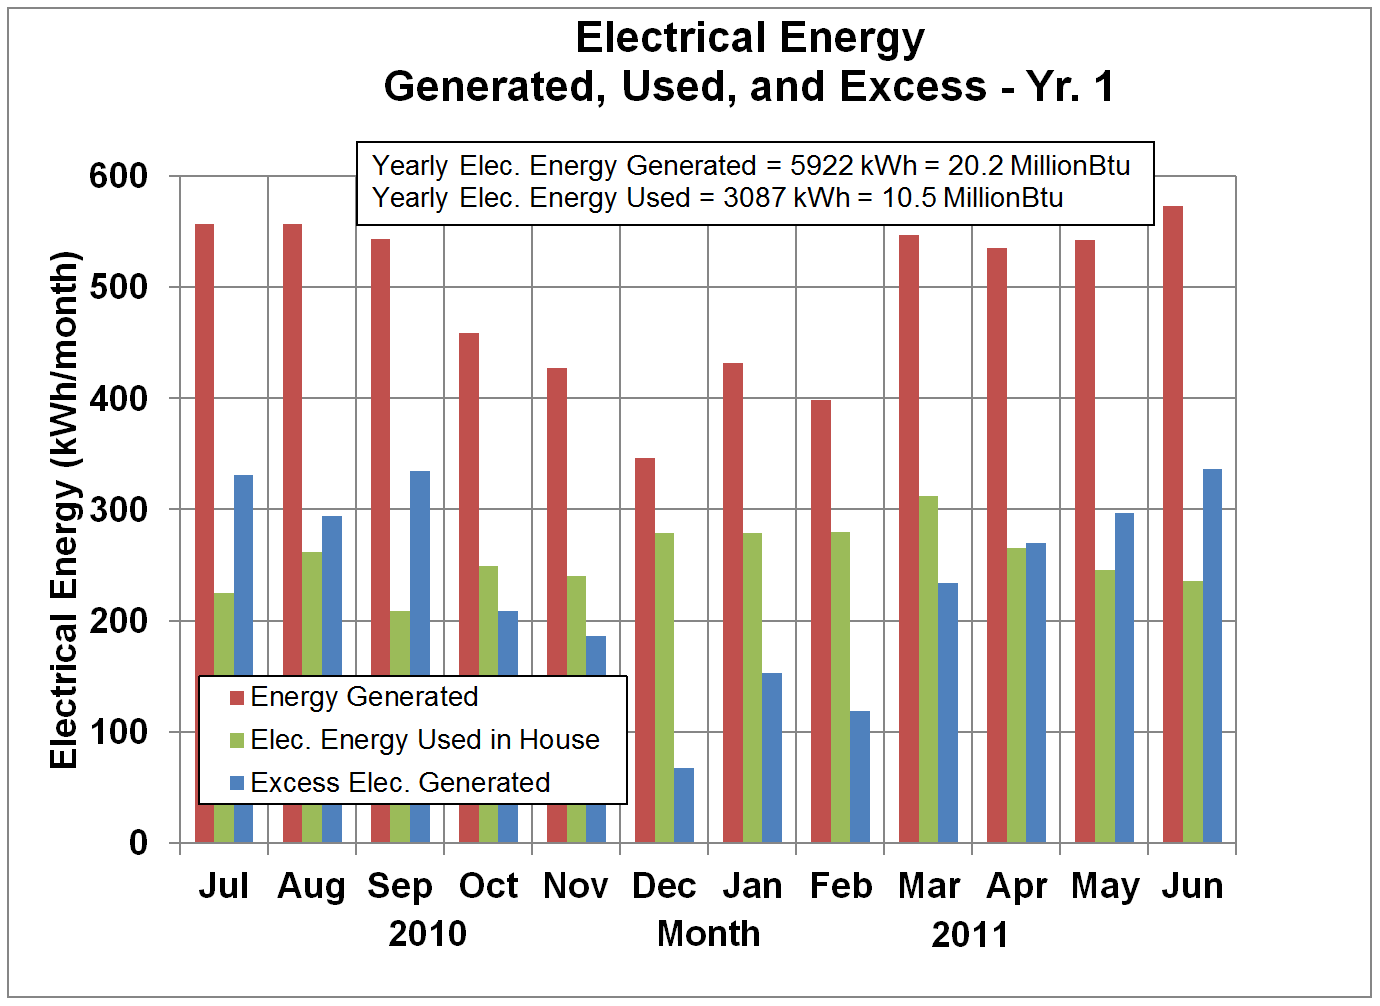
The PV system usually generates more power than is used by the house. The difference is the
energy that is available "in the bank," and is shown in the figures
below.
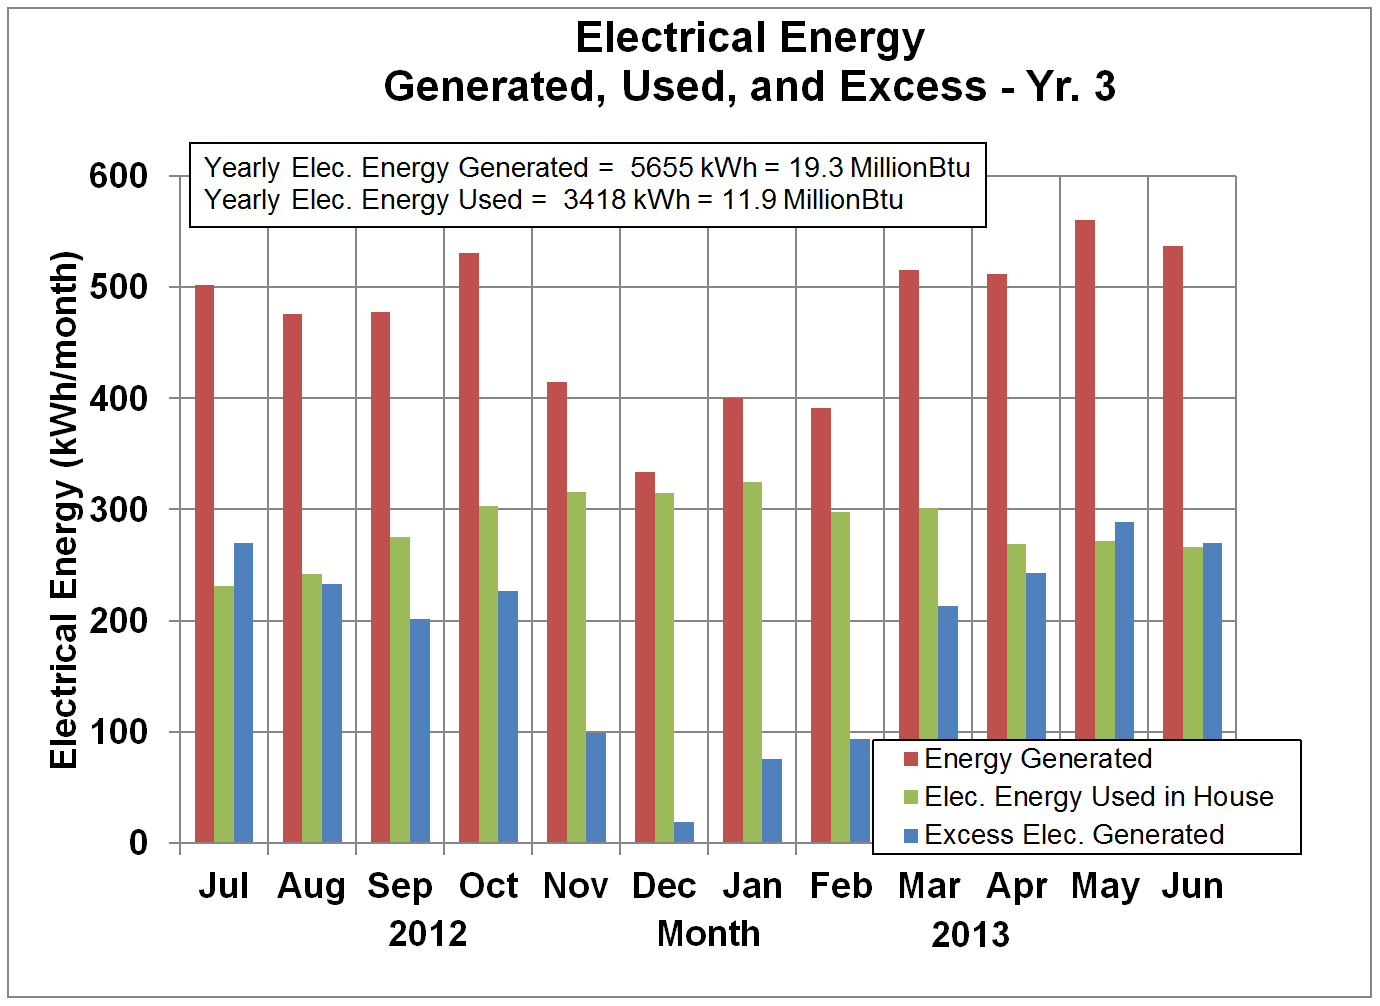 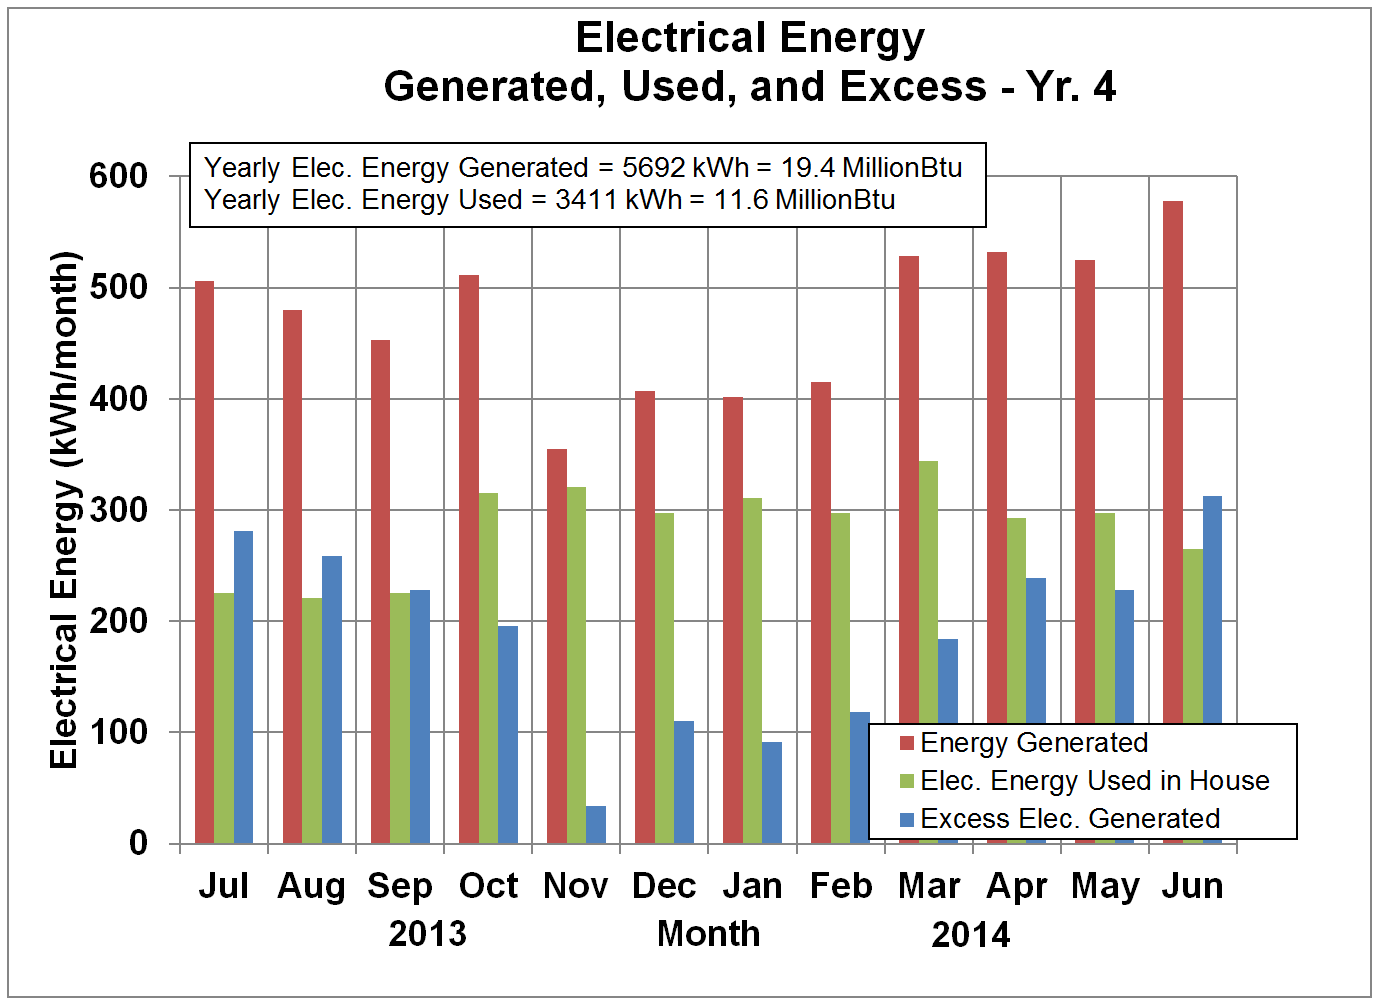
Whenever
the generated electricity exceeds the electricity used in the house,
the electric utility bill is limited to the connect fee plus taxes,
which has been $7.40 each month. The total generated and
consumed energy is summed up over a one-year period. If the
generated energy exceeds the energy consumed by the house so that net
energy is supplied to the utility company, then the homeowner has the
option to ask the utility company to pay for that excess energy, or to store the excess "in the bank."
Xcel Energy (the local electrical utility) pays the homeowner for
excess electricity at the wholesale rate, about $0.03/kWh, but charges
the homeowner the retail rate for net energy supplied to the house,
about $0.10/kWh. However, this net metering arrangement means
that the homeowner does not have to worry about storing energy in
batteries or otherwise, as the utility has the responsibility for
redistributing that excess energy elsewhere on the grid. Storing
energy in batteries is expensive as many batteries are required, and
battery lifetimes are limited, so the grid connection significantly
reduces the installed cost and headaches associated with batteries.
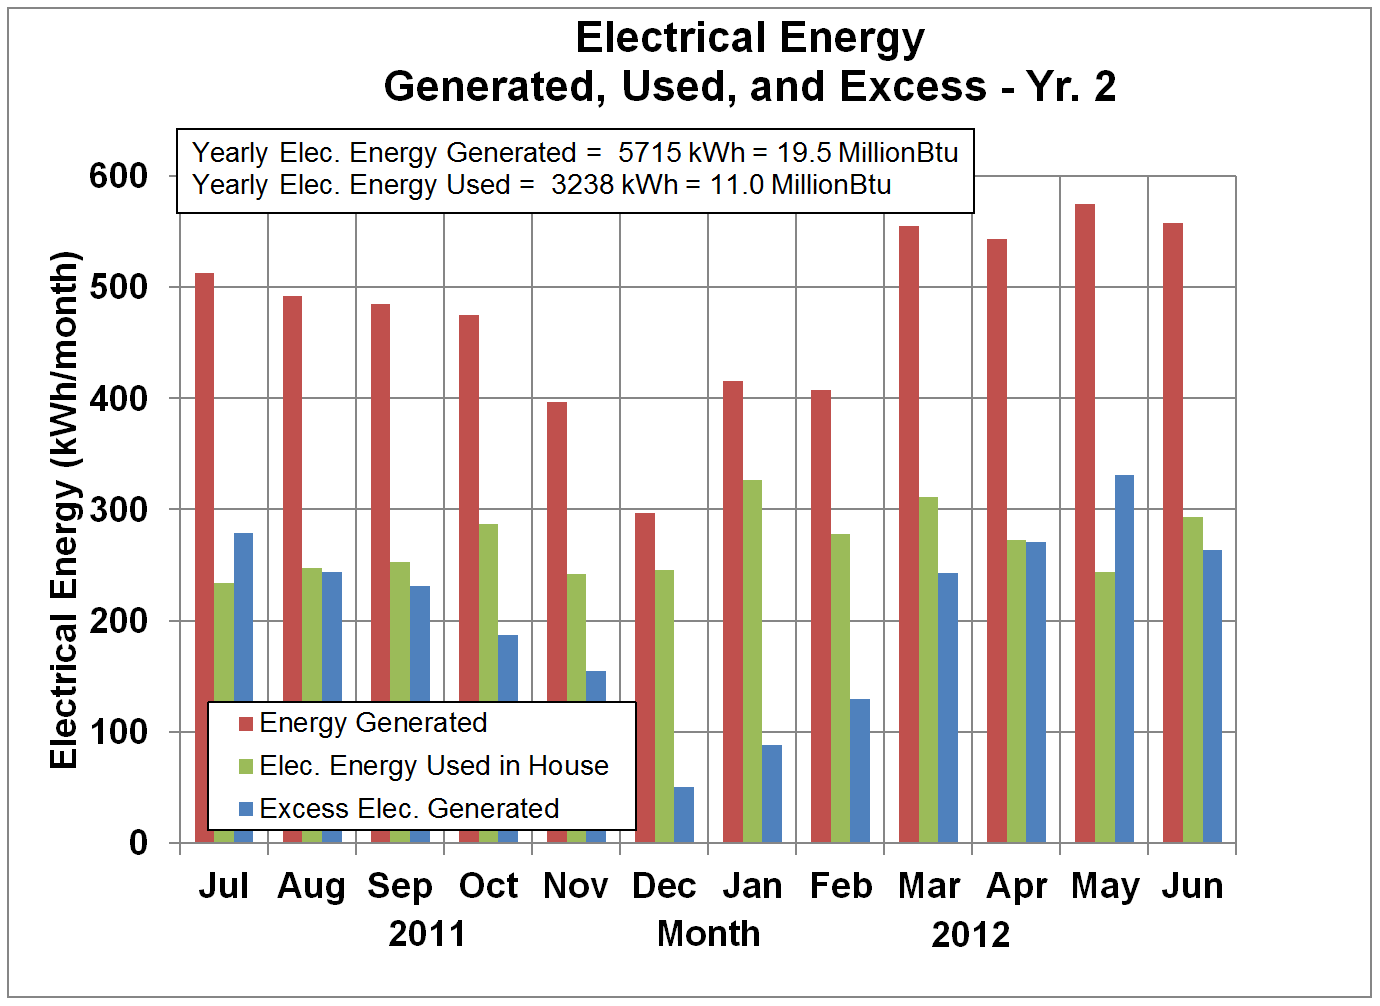
These
solar panels are guaranteed to produce at least 80% of their rated
power after 25 years. The calculations by PVWatts assume no loss
in power due to aging for new panels. For this study, it was
assumed that the panels would degrade in performance to 85% of their
rated power after 25 years by degrading a constant 0.65% each year,
starting in year 2. That performance degradation is included in
the figures above.
The
panels are not facing due south, but rather, 22° east of south.
The effect of these deviations from the "optimum" tilt and
azimuthal angle were evaluated using the computer model PVWatts v2.0, a
computer model developed by National Renewable Energy Laboratory
(NREL). PVWatts v2.0 is available for download at PVWatts v2.0.
The PV panels being tilted at 26.6°.from horizontal rather than being tilted at the latitude angle of 38.6° results in a predicted loss in generated power by about 1.9%, as shown in the figure below.
The
degradation in performance due to the panels not facing due south is
less than anticipated, at least according to PVWatts v2.0. If the
garage/workshop could be rotated while remaining flat on the ground,
that would be referred to as a change in azimuthal angle. The effect of
changing this azimuthal angle is shown in the figure below.
Interestingly,
the peak collection/generation efficiency is predicted by PVWatts v2.0
to be obtained when the panels are oriented 11° east of south. At
the actual orientation of the panels on the Residential Energy
Laboratory of 22° east of south, the predicted power is 0.2% greater
than if the panels were oriented due south. This serendipitous
result is due to at least two factors. First, anyone who
has lived in the Colorado mountains knows that summer mornings are
almost always clear, and summer afternoons often have clouds and sometimes rain (usually light).
Therefore, collecting the morning sun by rotating the panels
a little east of south is an advantage. Second, the generation
efficiency of PV panels is dependent on the panel temperatures, with the
efficiency dropping as the temperatures increase. Since the
morning temperatures are significantly lower than the afternoon
temperatures in this high mountain desert, then pointing the panels
east of south should increase power output. According to NREL, both of these
factors are accounted for in PVWatts and lead to the trend shown in the
figure above.
Solar Photovoltatic Derate Factors as Provided by SunPower
|
Loss Name
|
PVWatts
|
SunPower
|
Explanation of Loss
|
References
|
|
PV Module Nameplate DC Rating
|
0.950
|
0.980
|
Light-induced degradation (LID),
Deviation of actual module power from nameplate
|
1, 2
|
|
Inverter and Transformer
|
0.92
|
0.945
|
DC-to-AC energy conversion loss in
inverter and transformer
|
3
|
|
Mismatch
|
0.98
|
0.98
|
Power lost due to non-optimal
operating point of modules. Mismatch is minimized when module Isc
distribution is tight.
|
2
|
|
Diodes and Connections
|
0.995
|
1.000
|
Losses through diodes external to the
PV module junction box. Not applicable to most SunPower systems. Losses
through the diodes integral to the module are included in the module flash
test result.
|
|
|
DC Wiring
|
0.98
|
0.99
|
Loss in DC wiring depends on system design.
0.99 loss is based on typical SunPower system design.
|
4
|
|
AC Wiring
|
0.99
|
0.998
|
Loss in AC wiring depends on system
design. 0.998 loss is based on typical SunPower system design.
|
4
|
|
Soiling
|
0.95
|
0.95
|
Soiling losses are specific to region.
SunPower uses 0.95 for arid regions and 0.99 for rainy regions
|
5
|
|
System availability
|
0.980
|
0.980
|
No change from PVWatts default
|
|
|
Shading
|
1.000
|
1.000
|
No change from PVWatts default
|
|
|
Sun-tracking
|
1.000
|
1.000
|
No change from PVWatts default
|
|
|
Aging
|
1.000
|
1.000
|
No change from PVWatts default
|
|
|
Total
|
0.770
|
0.835
|
|
|
References:
1 – Photon Magazine article on LID
2 – Show table with up-to-date module flash test average and
distribution for modules most often sold into RLCC (SunPower)
3 – Include spec sheets for inverters most often used in
RLCC (SunPower), or show table with CEC efficiency values for these inverters and
reference CEC website link.
4 – show representative electrical schematic of SunPower
system, including take-offs to show wire lengths and gages. Show simple
calculation of ohmic losses in DC side based on average annual array current
from PVSim. Also show placement of inverter relative to breaker, and show
similar ohmic loss calculation for AC side.
5 – reference SunPower soiling papers from IEEE 2006 and
PVSEC 2007
|